# Query Example (Auto-Extract All Table Data from Drawings)
Automatically recognizing and exporting table data from CAD drawings is an important requirement in related data processing. Because CAD graphics do not have explicit row/column structure like spreadsheets, tables are often represented as lines and text. Manual extraction is time-consuming, error-prone, and tedious. Automating table structure recognition, data extraction, and export to Excel, CSV, and similar formats has become key to improving efficiency. Below are several common approaches:
# Common Methods
# 1. Geometry-Based Parsing
In CAD drawings, tables are usually made of horizontal and vertical lines or other geometry. The idea is to parse these objects and infer table structure.
Main steps:
- Object extraction: Extract geometric objects from the CAD file. Typically, horizontal and vertical lines form table borders, and text objects represent content.
- Structure recognition: Detect patterns of parallel and perpendicular lines to determine rows and columns. Spacing and intersections can indicate whether lines form table cells.
- Text matching: Identify and match text in each cell, usually by mapping text position to the table framework.
Advantages:
- High accuracy for clearly structured, regular tables.
- Suitable for programmatic, batch processing of many CAD files.
Limitations:
- Complex or irregular tables may be hard to recognize automatically.
- Requires some programming and CAD knowledge.
# 2. AutoCAD Table Objects (Table Object)
Since AutoCAD 2005, CAD has included dedicated table objects. This is another effective way to recognize and export table data. AutoCAD table objects are similar to Excel tables, with clear row/column structure and cell content.
Main steps:
- Read table objects directly: Through AutoCAD APIs (e.g. .NET API or ObjectARX), read table objects to get row/column information and cell text/numbers.
- Extract and export: Use these APIs to export table content to CSV, Excel, or other formats for further analysis.
Advantages:
- Simple to use; structured data is easy to extract.
- High accuracy for standard table objects.
Limitations:
- Only works with drawings that contain AutoCAD table objects; cannot handle manually drawn tables.
# 3. OCR (Optical Character Recognition)
For complex or non-standard tables, especially manually drawn ones, geometry parsing can be difficult. OCR is a useful alternative. OCR recognizes text from images and can restore table structure with algorithms.
Main steps:
- Image conversion: Export the CAD drawing as a high-resolution image (e.g. PNG, TIFF).
- OCR recognition: Use OCR software to recognize text and table lines. Some advanced tools can detect rows and columns and restore a matrix structure.
- Data export: OCR tools often export directly to Excel or CSV.
Advantages:
- Effective for complex, manually drawn tables where geometry parsing is insufficient.
Limitations:
- OCR depends on image quality; low resolution can reduce accuracy.
- Special symbols or formatting may not be recognized correctly.
# Summary
AutoCAD table objects cannot handle tables drawn with lines. OCR works on images; for complex CAD drawings, interference factors often lead to poor accuracy. Geometry-based parsing, although more complex to implement, offers the best performance and results when feasible, and is more general-purpose, ensuring data accuracy and completeness.
# Geometry-Based Table Parsing Algorithm
Parse geometric objects (lines, text, etc.) in the CAD file, determine whether they form a table structure, and extract data. Implementation steps:
# 1. CAD File Reading and Parsing
First, use the VJMap data query API VJMap Data Query to query all lines, polylines, 2D polylines, 3D polylines, single-line text, and multiline text. For memory mode, use Backend Expression Query to query all entities.
# 2. Geometry Extraction and Classification
Tables are typically made of horizontal and vertical lines, so the first task is to filter these. For more complex drawings, polylines or rectangles may also be needed. If polylines represent cell borders, they must be decomposed into line segments.
When extracting lines, obtain geometric parameters including start and end coordinates. For each line, record direction (horizontal or vertical), length, and position. Also extract text objects and determine which cell they belong to based on insertion point and table framework.
# 3. Table Framework Recognition
Table frameworks are formed by intersecting horizontal and vertical lines. Recognition focuses on whether these lines form a regular row/column layout:
- Horizontal vs. vertical: Use slope or start/end positions to classify lines.
- Line clustering: Group parallel lines with similar spacing. For example, sort horizontal lines by Y and group those with similar Y within a tolerance. Do the same for vertical lines by X to form columns.
- Intersection computation: Use intersections of horizontal and vertical lines to define cell boundaries and key vertices.
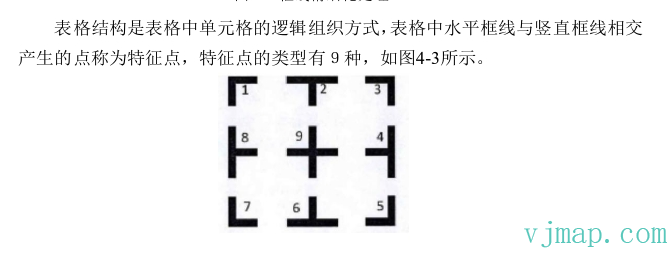
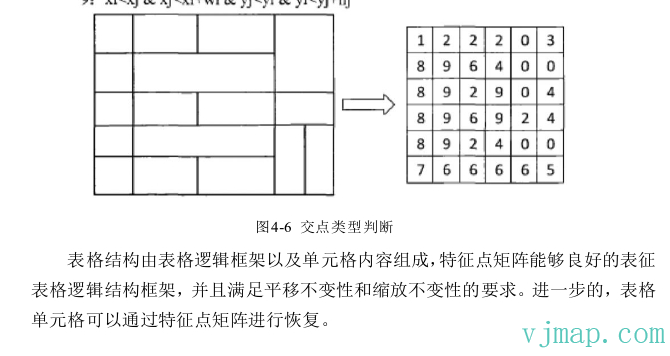
Relevant papers, such as "Algorithm Improvements in Table Recognition," describe feature-point-based table border recognition that is very helpful.
# 4. Cell Structure Extraction
After identifying the framework, use intersections of horizontal and vertical lines to define each cell. Each cell’s extent is defined by adjacent lines. Handle missing lines (e.g. incomplete manually drawn tables) with inference and completion.
# 5. Text-to-Cell Association
Table data is usually in text form. Text has insertion point, font, and content. To associate text with cells, compare each text insertion point with the identified cell extents. Methods include:
- Coordinate matching: Check whether the insertion point lies inside a cell. Adjust for alignment (e.g. bottom-left or center).
- Multiple text per cell: If a cell has multiple text objects, merge or separate content according to rules.
# 6. Merged Cell Recognition
Merged cells are common. Identify them by checking whether adjacent cells share boundaries. If lines are missing and adjacent cells have the same content, treat them as merged. When outputting, unify merged cell content and adjust format for consistency.
# 7. Optimization and Error Handling
Consider these cases during parsing:
- Broken or discontinuous lines: Lines may have small gaps due to drawing precision. Use a tolerance to handle them.
- Other geometry: Other shapes or annotations may interfere. Filter to process only table-related geometry.
# Implementation Result
Upload the CAD drawing to the VJMap Cloud Management Platform (opens new window). After opening it, click "Auto-extract all tables in the drawing" under "More Features".
For complex or imprecise drawings, you can increase the tolerance or use "Select region to manually extract table data".
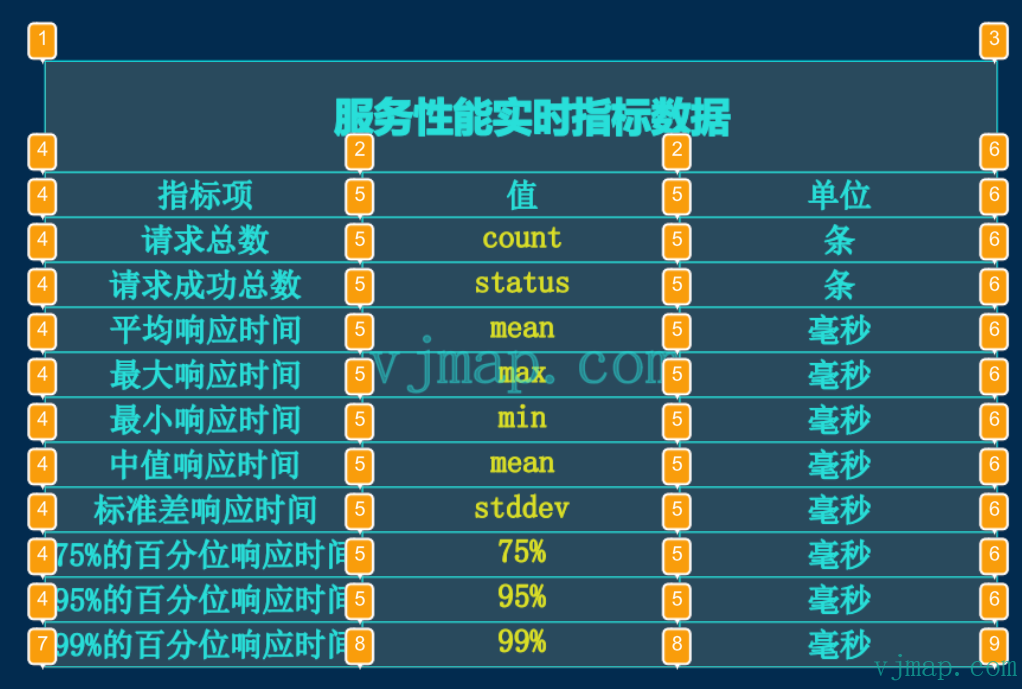
The extracted data is returned as json from the backend. The example displays it with a table component. To export to Excel or CSV, extend this example (which is open source).
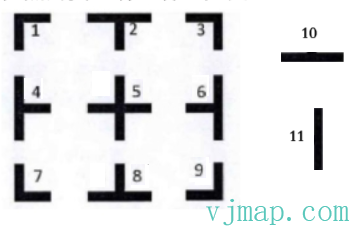
In VJMap, table feature points use the following values. You can click "Debug output" for "Position identifier" in the settings to inspect.
API documentation:
/**
 * Auto-extract table parameters
 */
export interface IExtractTable {
    /** Map ID. */
    mapid?: string;
    /** Map version (uses current open map version when empty). */
    version?: string;
    /** Layer style name. Empty means determined by selected entity layer */
    layer?: string;
    /** Extent [x1,y1,x2,y1]. Empty means whole map, otherwise query specified region. */
    bounds?: string;
    /** Query condition (default all lines). */
    condition?: string;
    /** Output debug data. */
    debug?: boolean;
    /** Decimal precision. Positive = digits after decimal, negative = digits before. Default 4 */
    digit?: number;
    /** Tolerance. Positive = distance below which lines are treated as same (0 = auto), negative = multiplier for auto tolerance. Default 0 (auto)*/
    tol?: number;
    /** Minimum table border points. Tables with fewer points are excluded. Default 12*/
    tableEdgeMinPoint?: number;
    /** Minimum table text count. Tables with fewer text objects are excluded. Default 4*/
    tableTextMinCount?: number;
    /** Maximum cell area ratio. Cell area / table area must not exceed this. Exceeded cells are excluded. Default 90*/
    cellMaxArea?: number;
    /** Minimum empty ratio. Tables with empty ratio above this are excluded. Default 90*/
    cellEmptyRatio?: number;
    /** Maximum cell count. Tables with more cells are excluded. Default 100000 */
    tableMaxCellCount?: number;
    /** Allowed polyline segments. Default only horizontal/vertical lines. Set to allow polyline segments. Default 0 */
    noHvLineSegCount?: number;
    /** Allow duplicate table data. Allows more tables but same data may appear in multiple. Default false */
    seachTableMost?: boolean;
    /** Find submap extents. Default false */
    findChildMapRects?: boolean;
}
/**
     * Auto-extract tables from the drawing
     * @param param Parameters
     * @return {Promise<any>}
     */
async cmdExtractTable(param: IExtractTable)
2
3
4
5
6
7
8
9
10
11
12
13
14
15
16
17
18
19
20
21
22
23
24
25
26
27
28
29
30
31
32
33
34
35
36
37
38
39
40
41
42
43
Try it online: https://vjmap.com/app/cloud/#/map/sys_table?version=v1&mapopenway=GeomRender&vector=false (opens new window)
# Extended Use
The auto-split submap algorithm was implemented on the frontend. With slight modifications to the table extraction algorithm, it can also be used to obtain all submap extents.
Set the findChildMapRects parameter in the API to true to get all submap extents, then call the split submap function.
/**
 * Split submap parameters
 */
export interface ISplitChildMaps {
    /** Map ID. */
    mapid?: string;
    /** File ID. (mapid takes precedence when both mapid and fileid exist) */
    fileid?: string;
    /** Map version (uses current open map version when empty). */
    version?: string;
    /** Whether each submap is full extent after split. Default false */
    isFullExtent?: boolean;
    /** Submap extent array. ["x1,y1,x2,y2",  "x1,y1,x2,y2", ...] */
    clipBounds: string[];
    /** Method cloneObjects: deep clone entities, fastest (default). cloneDb: clone document database, faster. cloneMap: clone map, slowest but preserves original best*/
    method?: "cloneObjects" | "cloneDb" | "cloneMap";
    /** Run in new process (does not block main process, may start slower initially). Default true */
    startNewProcess?: boolean;
}
/**
     * Split submaps
     * @param param Parameters
     * @return {Promise<any>}
     */
    async cmdSplitChildMaps(param: ISplitChildMaps)
2
3
4
5
6
7
8
9
10
11
12
13
14
15
16
17
18
19
20
21
22
23
24
25
Split submap online demo: https://vjmap.com/demo/#/demo/map/service/22findsubmapsplit2 (opens new window)