# Query Example (Auto-Label Positions by Survey Point ID)
No manual labeling required—automatically label positions on CAD drawings in the web client based on survey point IDs
# Requirements Analysis
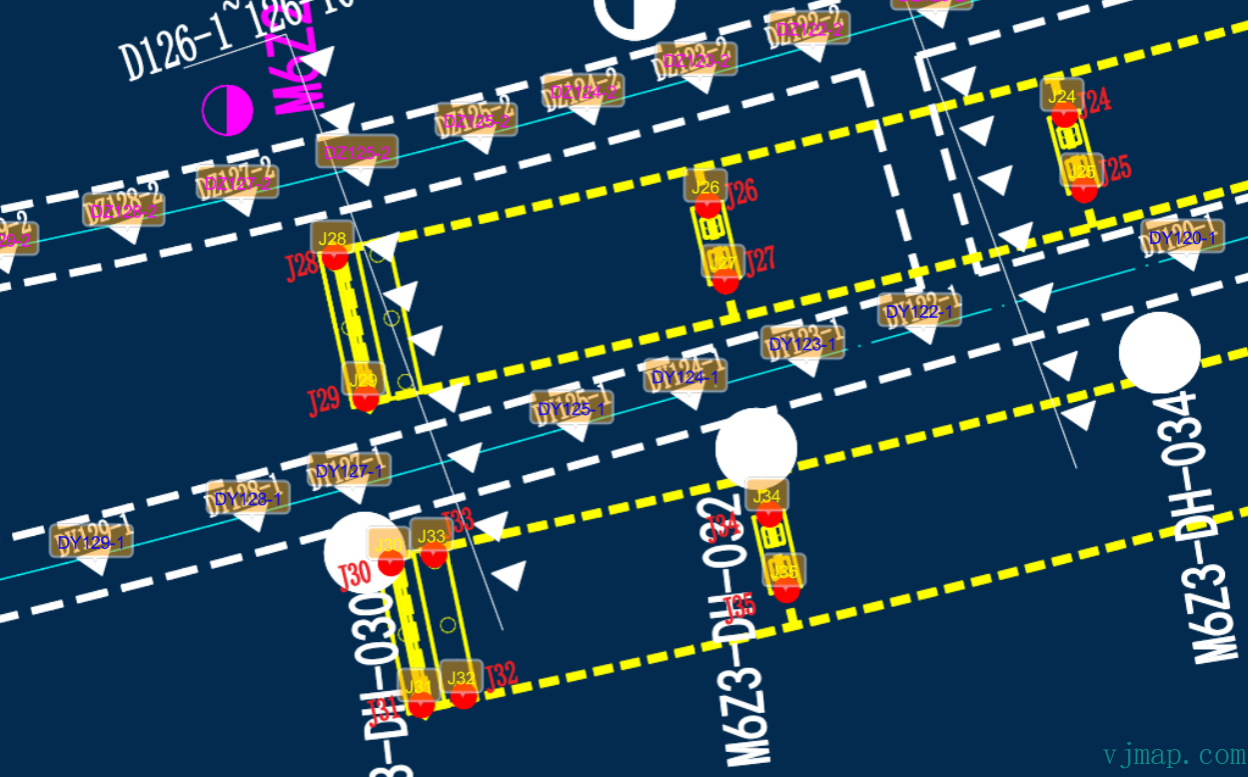
The CAD drawing looks like this:
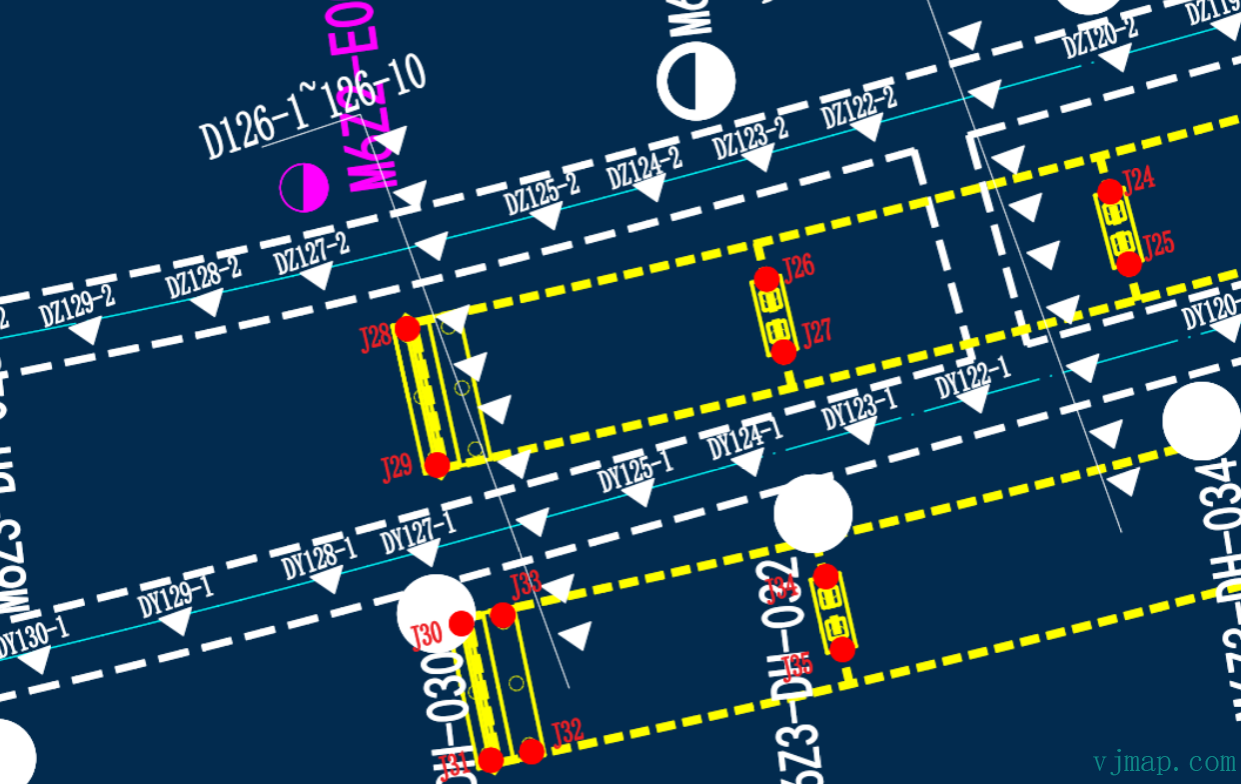
The backend database only has survey point IDs and values, as in the list below:
Survey Point ID Type Value
DZ129-2 Type 1 Value 1
DZ128-2 Type 1 Value 2
DZ127-2 Type 1 Value 3
J28 Type 2 Value 5
J26 Type 2 Value 6
J27 Type 2 Value 7
J29 Type 2 Value 8
.......
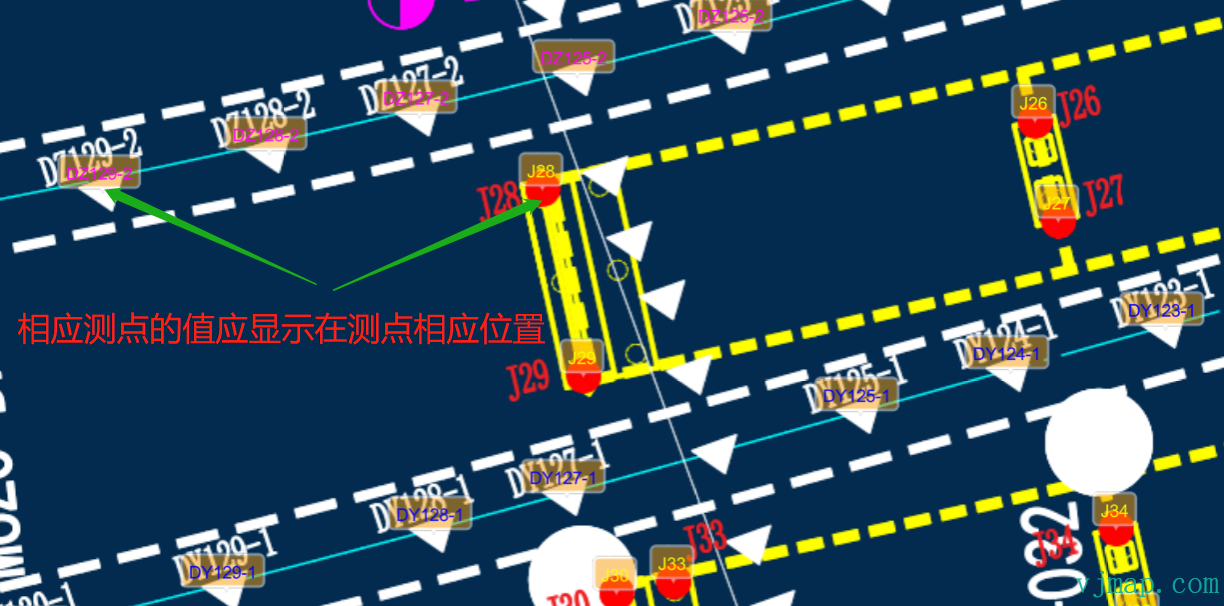
How can we display these survey point values at the corresponding positions on the CAD drawing? See below:
Since the backend database has no survey point coordinates, the traditional approach is to manually label each survey point on the map, save the positions to the database, and then retrieve both positions and survey data for display. The drawback is obvious: with many survey points, manual labeling is time-consuming and labor-intensive.
Is there a better way to compute survey point positions from the drawing with one click?
# Implementation
# Pattern Analysis
To find the geographic location for each survey point ID, we need to know the pattern or rules for each type.
For the two survey point types in the example:
Survey Type 1
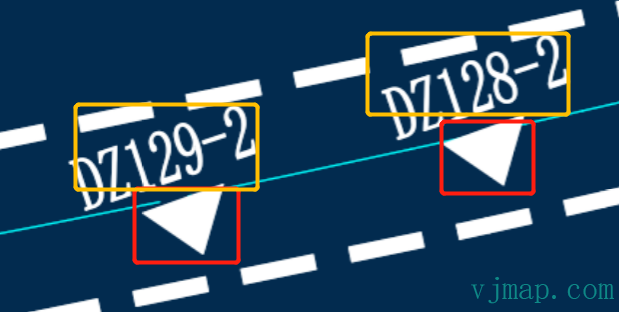
Pattern: Each survey point has a filled triangular symbol beside it
Survey Type 2
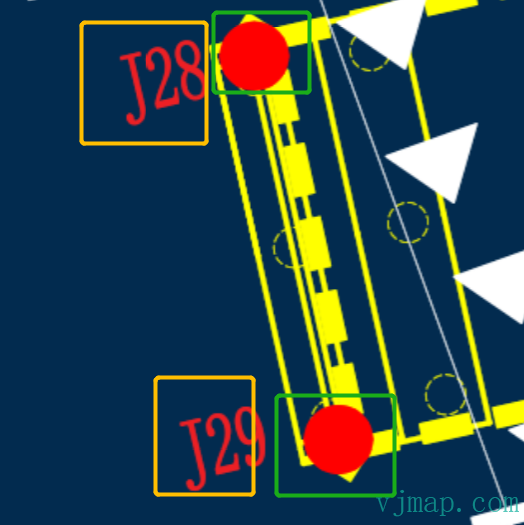
Pattern: Each survey point has a filled red circular symbol beside it
# Find Corresponding Graphic Symbols by Pattern
There are several ways to search, such as image recognition or geometry analysis. Image recognition is sensitive to noise and slower. Geometry analysis is faster and more accurate. We use geometry analysis here.
Steps:
(1) Traverse all entity types in the drawing
(2) Determine matches by entity type and extent size
# Search for Survey Point IDs Near Graphic Symbols and Build Associations
Steps:
(1) Search for text within a certain range of the symbol (e.g., a multiple of the symbol extent) and pick the nearest text
(2) Filter out non–survey point IDs by content rules (e.g., in this drawing survey IDs start with DZ or J and have limited length)
(3) Among all valid survey point IDs, pick the one closest to the symbol as the final survey point ID
(4) Associate the survey point ID with the symbol coordinates.
# Key Code Implementation
 const queryMapText = async () => {
            let query = await svc.conditionQueryFeature({
                // Query all text (single-line, multiline, block annotation, attribute text). See "Server-side Condition Query and Expression Query - Supported CAD Entity Types" for type numbers
                condition: `(name='12' or name='13' or name='26' or name='27') and LENGTH(s4) >= 2 and LENGTH(s4) <=12 and ( s4 like 'J%'  or s4 like 'DZ%')`,
                fields: "",
                limit: 100000 // Query all
            })
            if (query.error) {
                message.error(query.error)
            } else {
                query.result.forEach(rst => {
                    rst.position = vjmap.GeoPoint.fromString(rst.location); // Get coordinates
                })
                return  query.result;
            }
        }
        // Get text info from the drawing
        let mapAllText = await queryMapText();
        console.log(mapAllText);

        // Find all hatches
        const queryHatch = async () => {
            let query = await svc.conditionQueryFeature({
                condition: `(name='11') `, // Type hatch
                fields: "",
                includegeom: true,
                limit: 100000 // Query all
            })
            if (query.error) {
                message.error(query.error)
            } else {
                query.result.forEach(rst => {
                    rst.geoBounds = vjmap.GeoBounds.fromString(rst.bounds); // Get extent
                    let w = rst.geoBounds.width();
                    let h = rst.geoBounds.height();
                    // If radius is 2, it's a circle, J_ type
                    if (vjmap.isZero(w - 2, 0.1) && vjmap.isZero(h - 2, 0.1))
                    {
                        rst.type = "circle_20";
                    } else {
                        if (rst.geom.geometries[0].type == "Polygon" && rst.geom.geometries[0].coordinates[0].length == 5) {
                            // If triangle hatch
                            if (vjmap.isZero(w - 2.5, 1) && vjmap.isZero(h - 2.5, 1))
                            {
                                rst.type = "triangle";
                            }

                        }
                    }

                })

                return  query.result;
            }
        }
        // Get hatch info from the drawing
        let mapAllCircleHatch = await queryHatch();
        console.log(mapAllCircleHatch);

        // Circles are paired with text starting with J
        let dataCircleTextG = mapAllCircleHatch.filter(rst => rst.type == "circle_28")
        dataCircleTextG.forEach(circle => {
            // Find the nearest text starting with J
            let texts = mapAllText.filter(t => t.text.substr(0, 1) == "J")
            let findTexts = texts.filter(t => t.position.distanceTo(circle.geoBounds.center()) <= 2.8 * 3) // Find matching text
            // Pick the nearest
            if (findTexts.length > 0) {
                findTexts = findTexts.sort((a, b) => a.position.distanceTo(circle.geoBounds.center()) - b.position.distanceTo(circle.geoBounds.center()) )
                drawDatas.push({
                    point: circle.geoBounds.center(),
                    name: findTexts[0].text,
                    color: "#0f0"
                })
            }

        })

        // Triangles are paired with text starting with DZ
        let dataTriangleTextDz = mapAllCircleHatch.filter(rst => rst.type == "triangle")
        dataTriangleTextDz.forEach(tri => {
            // Find the nearest text starting with DZ
            let texts = mapAllText.filter(t => t.text.substr(0, 2) == "DZ")
            let findTexts = texts.filter(t => t.position.distanceTo(tri.geoBounds.center()) <= 2.8 * 3) // Find matching text
            // Pick the nearest
            if (findTexts.length > 0) {
                findTexts = findTexts.sort((a, b) => a.position.distanceTo(tri.geoBounds.center()) - b.position.distanceTo(tri.geoBounds.center()) )
                drawDatas.push({
                    point: tri.geoBounds.center(),
                    name: findTexts[0].text,
                    color: "#f0f"
                })
            }
        })

        console.log(drawDatas)
        // Display data on the map
        let symbols;
        const showDataInMap = (datas)=> {
            let geoDatas = []
            for(let i = 0; i < datas.length; i++) {
                const pt = datas[i].point;
                const data = {
                    point: map.toLngLat(pt),
                    properties: {
                        name:  datas[i].name,
                        textColor: datas[i].color
                    }
                }
                geoDatas.push(data);
            }
            if (symbols) {
                symbols.remove();// Remove existing first
            }
            symbols = new vjmap.Symbol({
                data: geoDatas,
                iconImage: "stretchTextBackImg",
                iconAnchor: "bottom",
                iconOpacity: 0.5,
                iconOffset: [-2, -10],
                textTranslate: [-2, -6],
                textAnchor: "bottom",
                textField: ['get', 'name'],
                textFont: ['Arial Unicode MS Regular'],
                textSize: 14,
                textColor: ['get', 'textColor'],
                iconTextFit: "both",
                iconAllowOverlap: true,
                textAllowOverlap: true
            });
            symbols.addTo(map);
        }
        showDataInMap(drawDatas);
2
3
4
5
6
7
8
9
10
11
12
13
14
15
16
17
18
19
20
21
22
23
24
25
26
27
28
29
30
31
32
33
34
35
36
37
38
39
40
41
42
43
44
45
46
47
48
49
50
51
52
53
54
55
56
57
58
59
60
61
62
63
64
65
66
67
68
69
70
71
72
73
74
75
76
77
78
79
80
81
82
83
84
85
86
87
88
89
90
91
92
93
94
95
96
97
98
99
100
101
102
103
104
105
106
107
108
109
110
111
112
113
114
115
116
117
118
119
120
121
122
123
124
125
126
127
128
129
130
131
132
# Final Result
The example code above is open source. For data privacy, the demo uses sample maps from the VJMap website; the approach is the same. Visit https://vjmap.com/demo/#/demo/map/service/22findtextbyrules (opens new window) to see the effect and code.