# Map Comparison
In practice, when drawings are updated, comparing drawings to find differences has always been time-consuming and labor-intensive, and is a major pain point in the industry. Generally, CAD old vs. new drawing content comparison includes: added new graphic elements, removed original graphic elements, and modified original graphics. How can we easily implement drawing comparison on the web without relying on CAD environments?
# Implementation Approach
There are typically two approaches to compare drawing differences:
# Data Comparison Method
This method compares and analyzes the raw data of drawings. The idea is to traverse all entity elements in the drawing and compare differences one by one based on attribute data to find differences.
Advantages: Algorithm is accurate. Can locate different entity objects.
Disadvantages: High computational load when drawings are large; also, if the same entity is deleted and redrawn, the ObjectID will change, making it difficult to determine whether it is the same entity. Algorithm implementation is complex.
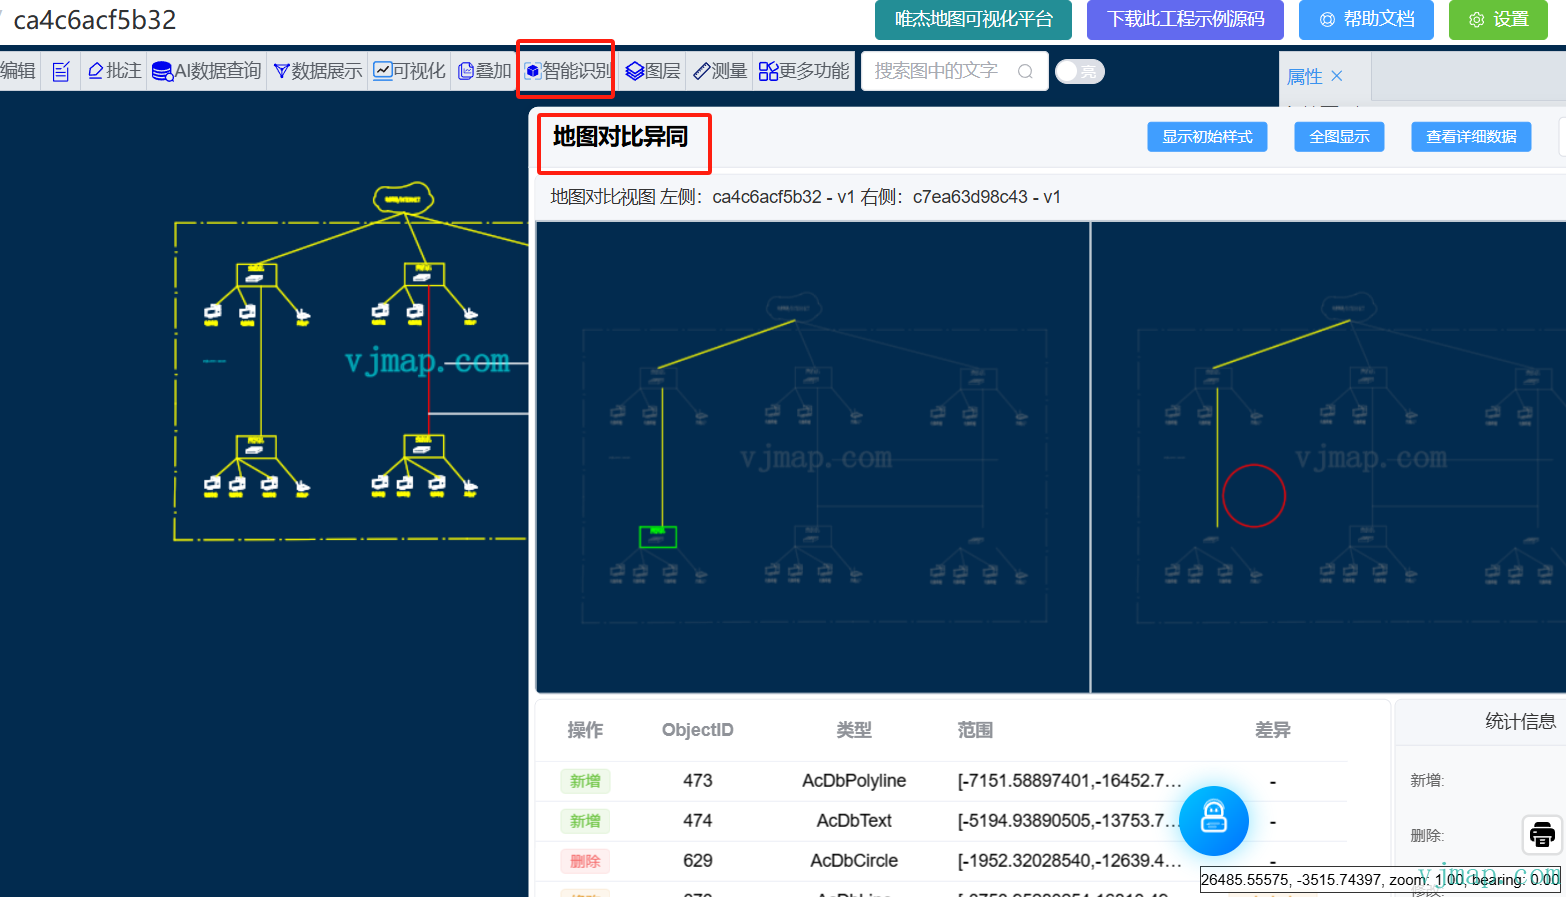
Example: Click the original map https://vjmap.com/app/cloud/#/map/ca4c6acf5b32?version=v1&mapopenway=GeomRender&vector=false (opens new window)
After entering, click Smart Recognition -> Map Comparison in the toolbar above
let result = await svc.execCommand("mapCompare", {
      mapid1: prop.mapid1,
      version1: prop.version1,
      mapid2: prop.mapid2,
      version2: prop.version2
    }, "_null", "v1");
2
3
4
5
6
# Pixel Comparison Method
This method compares based on rendered images. It analyzes and compares pixels of images to find different regions.
Advantages: Fast speed, relatively easy algorithm implementation.
Disadvantages: Can only locate different regions, cannot locate specific entities.
In actual requirements, we need to quickly locate differences without needing to identify specific entity objects. So we chose the pixel comparison method for comparison analysis.
Final effect:
Synchronous comparison analysis effect:
Map swipe effect:
# Algorithm Analysis
When you see image pixel comparison analysis, your first reaction might be that the algorithm is too simple. Compare pixels one by one to see if they're equal, and you know the differences. If you think that way, you're oversimplifying the problem. In practice, due to anti-aliasing during rendering, identical drawn content can still result in subtle pixel value differences. The core of the algorithm is to eliminate these interfering factors and find the truly different parts.
# Image Similarity Calculation Methods Summary
Cosine Similarity
Represent an image as a vector, and characterize the similarity between two images by calculating the cosine distance between vectors
For specific algorithm, refer to https://zhuanlan.zhihu.com/p/93893211 (opens new window)
Histogram
Measure similarity of histograms of two images according to some distance metric standard
For specific algorithm, refer to https://zhuanlan.zhihu.com/p/274429582 (opens new window)
Hash Algorithm
Perceptual hash can be used to determine the similarity of two images, often used for image retrieval. Perceptual hash algorithm generates a "fingerprint" for each image. By comparing fingerprints of two images, their similarity and whether they belong to the same image can be determined. Common types include: Average Hash (aHash), Perceptual Hash (pHash), and Difference Hash (dHash).
For specific algorithm, refer to this article (opens new window)
Pixel matching pixelmatch
Calculate similarity using pixel matching.
# Implementation
We perform comparison analysis on images based on BS mode to find differences. The server parses CAD drawings and generates pixel images; the pixelmatch algorithm finds differences. The browser loads CAD maps and displays the different areas.
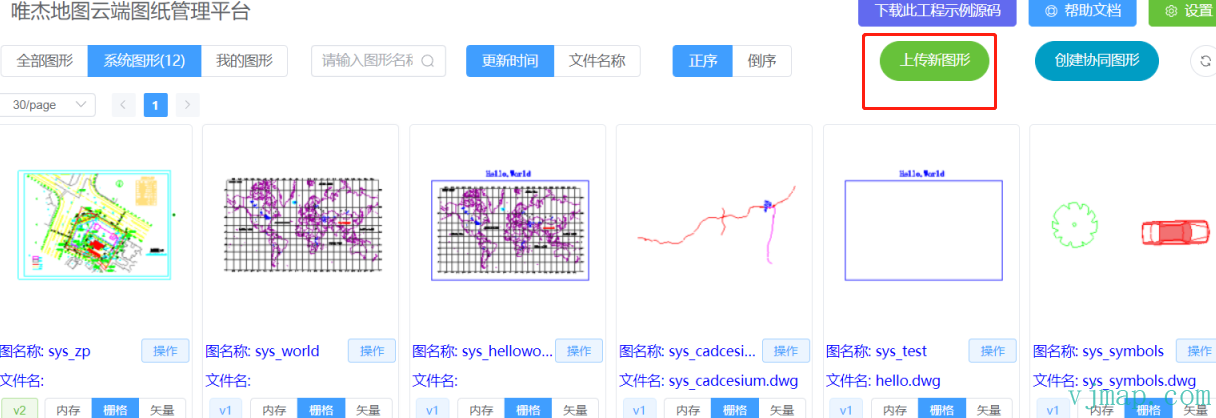
(1) Open CAD map online in Web
Display CAD graphics on the web page at VJMAP Cloud Drawing Management Platform (opens new window).
(2) Convert CAD map to image
Since VJMAP converts CAD maps to GIS data for rendering, the provided WMS service can render images of specified pixel size. For accurate comparison results, you can set the render level higher to get larger pixel images, which are clearer and produce more accurate comparison results.
Interface as follows:
/**
 * WMS service URL parameters
 */
export  interface IWmsTileUrl {
    /** Map ID (empty = current); array = request multiple. */
    mapid?: string | string[];
    /** Map version (empty = current). */
    version?: string | string[];
    /** Layer name (empty = current map layer). */
    layers?: string | string[];
    /** Bounds, default {bbox-epsg-3857}. For CAD extent without conversion use CAD bounds and leave srs, crs, mapbounds empty. */
    bbox?: string;
    /** Current CRS, default EPSG:3857. */
    srs?: string;
    /** CAD map CRS; empty = from metadata. */
    crs?: string | string[];
    /** Geographic bounds; when set, srs is ignored. */
    mapbounds?: string;
    /** Width. */
    width?: number;
    /** Height. */
    height?: number;
    /** Transparent. */
    transparent?: boolean;
    /** Four-parameter (x, y offset, scale, rotation rad), optional. */
    fourParameter?: string | string[];
    /** Vector tiles. */
    mvt?: boolean;
    /** Consider rotation for CRS conversion; default auto. */
    useImageRotate?: boolean;
}
2
3
4
5
6
7
8
9
10
11
12
13
14
15
16
17
18
19
20
21
22
23
24
25
26
27
28
29
30
31
(3) Pixel comparison analysis algorithm
The core anti-aliasing pixel comparison algorithm code is as follows:
uint8_t blend(uint8_t c, double a) {
    return 255 + (c - 255) * a;
}

double rgb2y(uint8_t r, uint8_t g, uint8_t b) { return r * 0.29889531 + g * 0.58662247 + b * 0.11448223; }
double rgb2i(uint8_t r, uint8_t g, uint8_t b) { return r * 0.59597799 - g * 0.27417610 - b * 0.32180189; }
double rgb2q(uint8_t r, uint8_t g, uint8_t b) { return r * 0.21147017 - g * 0.52261711 + b * 0.31114694; }

// Use YIQ NTSC color space for perceptual color difference

double colorDelta(const uint8_t* img1, const uint8_t* img2, std::size_t k, std::size_t m, bool yOnly = false) {
    double a1 = double(img1[k + 3]) / 255;
    double a2 = double(img2[m + 3]) / 255;

    uint8_t r1 = blend(img1[k + 0], a1);
    uint8_t g1 = blend(img1[k + 1], a1);
    uint8_t b1 = blend(img1[k + 2], a1);

    uint8_t r2 = blend(img2[m + 0], a2);
    uint8_t g2 = blend(img2[m + 1], a2);
    uint8_t b2 = blend(img2[m + 2], a2);

    double y = rgb2y(r1, g1, b1) - rgb2y(r2, g2, b2);

    if (yOnly) return y; // luminance difference only

    double i = rgb2i(r1, g1, b1) - rgb2i(r2, g2, b2);
    double q = rgb2q(r1, g1, b1) - rgb2q(r2, g2, b2);

    return 0.5053 * y * y + 0.299 * i * i + 0.1957 * q * q;
}

void drawPixel(uint8_t* output, std::size_t pos, uint8_t r, uint8_t g, uint8_t b) {
    output[pos + 0] = r;
    output[pos + 1] = g;
    output[pos + 2] = b;
    output[pos + 3] = 255;
}

double grayPixel(const uint8_t* img, std::size_t i) {
    double a = double(img[i + 3]) / 255;
    uint8_t r = blend(img[i + 0], a);
    uint8_t g = blend(img[i + 1], a);
    uint8_t b = blend(img[i + 2], a);
    return rgb2y(r, g, b);
}

// Check if pixel is likely part of antialiasing
bool antialiased(const uint8_t* img, std::size_t x1, std::size_t y1, std::size_t width, std::size_t height, const uint8_t* img2 = nullptr) {
    std::size_t x0 = x1 > 0 ? x1 - 1 : 0;
    std::size_t y0 = y1 > 0 ? y1 - 1 : 0;
    std::size_t x2 = std::min(x1 + 1, width - 1);
    std::size_t y2 = std::min(y1 + 1, height - 1);
    std::size_t pos = (y1 * width + x1) * 4;
    uint64_t zeroes = 0;
    uint64_t positives = 0;
    uint64_t negatives = 0;
    double min = 0;
    double max = 0;
    std::size_t minX = 0, minY = 0, maxX = 0, maxY = 0;

    // Traverse 8 neighbors
    for (std::size_t x = x0; x <= x2; x++) {
        for (std::size_t y = y0; y <= y2; y++) {
            if (x == x1 && y == y1) continue;

            // Luminance delta between center and neighbor
            double delta = colorDelta(img, img, pos, (y * width + x) * 4, true);

            // Count equal, darker, lighter neighbors
            if (delta == 0) zeroes++;
            else if (delta < 0) negatives++;
            else if (delta > 0) positives++;

            // Two or more equal neighbors => not antialiasing
            if (zeroes > 2) return false;

            if (!img2) continue;

            // Remember darkest pixel
            if (delta < min) {
                min = delta;
                minX = x;
                minY = y;
            }
            // Remember brightest pixel
            if (delta > max) {
                max = delta;
                maxX = x;
                maxY = y;
            }
        }
    }

    if (!img2) return true;

    // No both darker and lighter neighbors => not antialiasing
    if (negatives == 0 || positives == 0) return false;

    // If darkest or brightest has two+ equal neighbors in both images (not antialiased), this pixel is antialiased
    return (!antialiased(img, minX, minY, width, height) && !antialiased(img2, minX, minY, width, height)) ||
           (!antialiased(img, maxX, maxY, width, height) && !antialiased(img2, maxX, maxY, width, height));
}

}
2
3
4
5
6
7
8
9
10
11
12
13
14
15
16
17
18
19
20
21
22
23
24
25
26
27
28
29
30
31
32
33
34
35
36
37
38
39
40
41
42
43
44
45
46
47
48
49
50
51
52
53
54
55
56
57
58
59
60
61
62
63
64
65
66
67
68
69
70
71
72
73
74
75
76
77
78
79
80
81
82
83
84
85
86
87
88
89
90
91
92
93
94
95
96
97
98
99
100
101
102
103
104
105
(4) Frontend call algorithm and display
Related code:
// Map diff
let diff = await service.cmdMapDiff({
    // Map 1 ID
    mapid1: mapId1,
    // Map 1 version (empty = latest)
    version1: "",
    // Map 1 style layer (empty = default)
    layer1: map1.getService().currentMapParam().layer,
    // Map 2 ID
    mapid2: mapId2,
    // Map 2 version (empty = latest)
    version2: "",
    // Map 2 style layer (empty = default)
    layer2: map2.getService().currentMapParam().layer
})

if (diff.error) {
    message.error(diff.error);
    return;
}

const drawPolygons = (map, points, color) => {
    if (points.length === 0) return;
    points.forEach(p => p.push(p[0])); // close ring
    let polygons = points.map(p => {
        return {
            points: map.toLngLat(p),
            properties: {
                color: color
            }
        }
    })
    vjmap.createAntPathAnimateLineLayer(map, polygons, {
        fillColor1: color,
        fillColor2: "#0ffb",
        canvasWidth: 128,
        canvasHeight: 32,
        frameCount: 4,
        lineWidth: 4,
        lineOpacity: 0.8
    });
}
if (diff.modify.length === 0) {
    message.info("No differences found.");
    return;
}
// Modified
drawPolygons(map2, diff.modify, "#f00");
// Added
drawPolygons(map2, diff.new, "#0f0");
// Deleted
drawPolygons(map1, diff.del, "#00f");
2
3
4
5
6
7
8
9
10
11
12
13
14
15
16
17
18
19
20
21
22
23
24
25
26
27
28
29
30
31
32
33
34
35
36
37
38
39
40
41
42
43
44
45
46
47
48
49
50
51
52
The above frontend implementation code has been open-sourced to GitHub. Address: https://github.com/vjmap/vjmap-playground/blob/main/src/02service_%E5%9C%B0%E5%9B%BE%E6%9C%8D%E5%8A%A1/17zmapDiff.js (opens new window)
Online demo: https://vjmap.com/demo/#/demo/map/service/17zmapDiff (opens new window)