# 地图个性化
# 后端个性化地图
通过自定义样式表达式使后端渲染不同的数据样式,优点:能适用于栅格瓦片或矢量瓦片,但效果会稍有延迟。
/**
  * 获取样式图层名
  * @param style 样式参数
  * @param mapid 地图ID
  * @param version 版本号,为空,则获取最新的;
  * @param isGeomLayer 几何渲染图层优先(默认true)
  * @return {Promise<any>}
  */
 createStyle(style: {
    /** 样式名称. */
    name?: string;
    /** 要开的图层索引列表,格式如[0,1,3]. */
    layeron?: string | number[];
    /** 要关的图层索引列表,格式如[2,4]. layeron与layeroff只要输入一个即可*/
    layeroff?: string | number[];
    /** 地图裁剪范围,范围如[x1,y1,x2,y2].如果只需入了数值的话,表示是缩放倍数 */
    clipbounds?: [number, number, number, number] | number;
    /** 颜色. */
    backcolor?: number;
    /** 线宽,格式如[1,1,1,1,0].表式第1,2,3,4级线宽开,第5级线宽关,大于第5级的,以最后设置的级别状态为主,所以也是关。如为空,则和原图线宽显示状态相同 */
    lineweight?: string | number[];
    /** 表达式. */
    expression?: string;
}, mapid?: string, version?: string, isGeomLayer?: boolean): Promise<any>;
1
2
3
4
5
6
7
8
9
10
11
12
13
14
15
16
17
18
19
20
21
22
23
24
2
3
4
5
6
7
8
9
10
11
12
13
14
15
16
17
18
19
20
21
22
23
24
expression的语法可参考文档 服务端渲染表达式语法 和 服务端条件查询和表达式查询
# 创建一个高科技蓝的表达式写法为
var color := gFilterCustomTheme(gInColorRed, gInColorGreen, gInColorBlue, 200, 200, 0.1);
gOutColorRed[0] := gRed(color);
gOutColorGreen[0] := gGreen(color);
gOutColorBlue[0] := gBlue(color);
1
2
3
4
2
3
4
更多个性化地图样式示例 (opens new window)
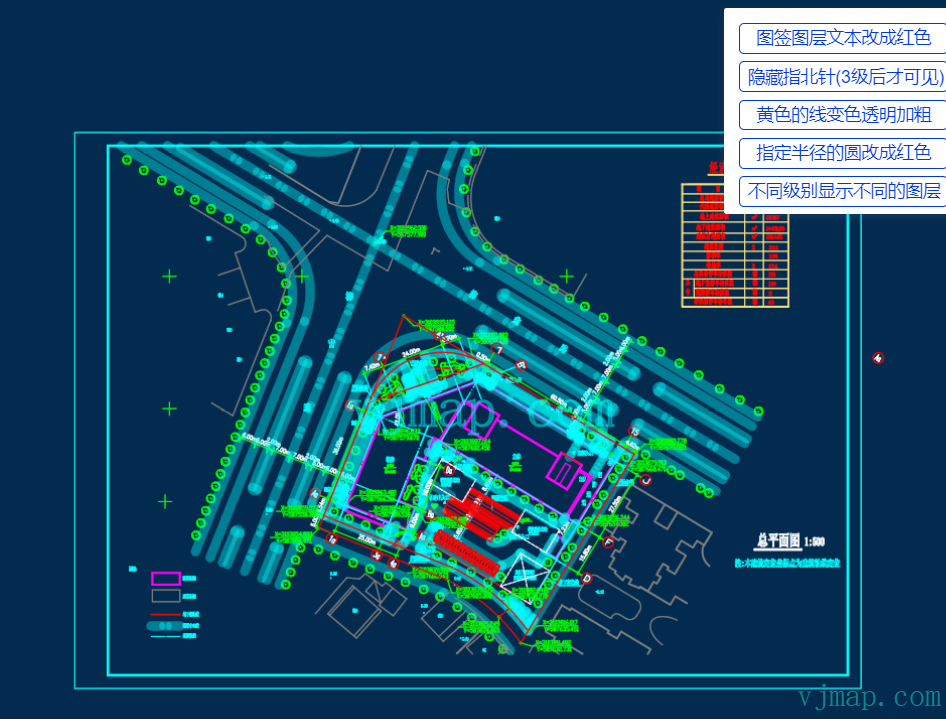
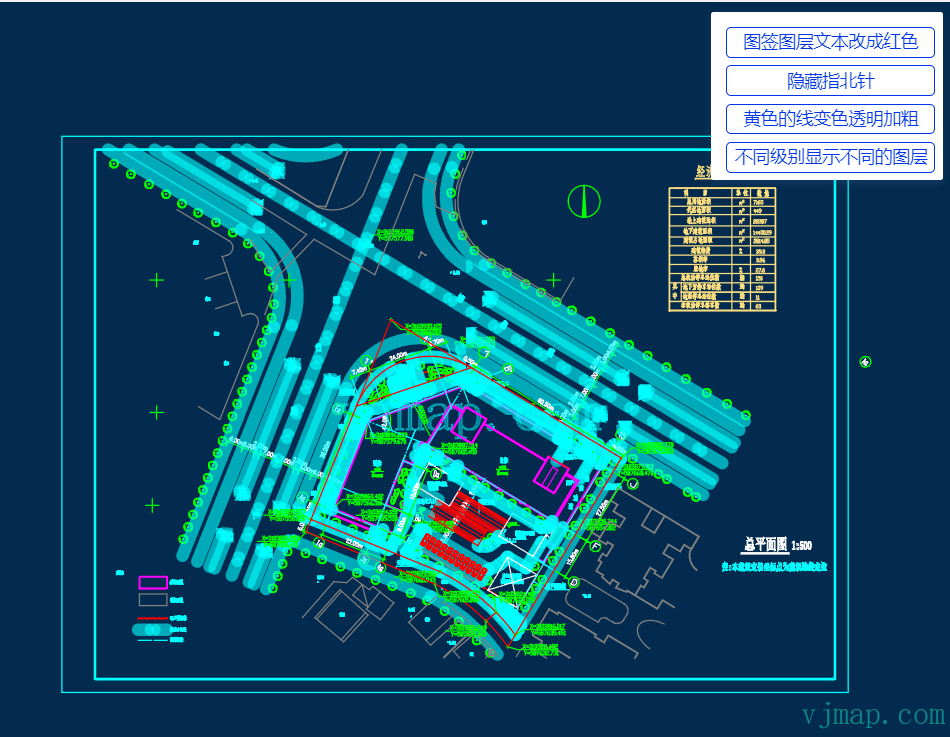
# 图签图层文本改成红色
表达式写法:
if((gInFeatureType=='AcDbText' or gInFeatureType=='AcDbMText' or gInFeatureType=='AcDbAttributeDefinition' or gInFeatureType=='AcDbAttribute') and (gInLayerName=='WZ')) {
    gOutColorRed:=255;
    gOutColorGreen:=0;
    gOutColorBlue:=0;
}
1
2
3
4
5
2
3
4
5
# 隐藏指北针(3级后才可见)
表达式写法:
if(gInObjectId  in  '10D_10F__111_#||10D_10F__110_#') {
    gOutVisible[2]:=0;
    gOutVisible[4]:=1;
}
1
2
3
4
2
3
4
# 黄色的线变色透明加粗
表达式写法:
if((gInColorRed==255 and gInColorGreen==255 and gInColorBlue==0)) {
    gOutLineWidth:=5;
    gOutColorRed:=0;
    gOutColorGreen:=255;
    gOutColorBlue:=255;
    gOutColorAlpha:=100;
}
1
2
3
4
5
6
7
2
3
4
5
6
7
# 指定半径的圆改成红色
表达式写法:
if(((abs(gInExtendMaxX-gInExtendMinX-4000)<20))) {
    gOutColorRed:=255;
    gOutColorGreen:=0;
    gOutColorBlue:=0;
}
1
2
3
4
5
2
3
4
5
# 不同级别显示不同的图层
通过设置样式中的 layeron 实现
let style = {
        // 不同级别下 layeroff 控制图层索引是否关闭图层, layeron 来控制图层索引是否打开图层
        layeron:`{
                        "*": "()",
                        "1": "(19,24)",
                        "2": "(19,24,5)",
                        "3-4": "(1,19,24,5,22)",
                        "5": "(1,19,24,5,22,15)",
                        "6-7": "(1,2,3,4,5,6,7,8,9,10,11,12,13,14,15,16,19,22,24)"
                    }`
}
1
2
3
4
5
6
7
8
9
10
11
2
3
4
5
6
7
8
9
10
11

# 前端个性化地图(矢量瓦片)
通过修改矢量瓦片的样式在前端修改渲染数据,优点:速度快,但只能用于矢量瓦片
# 图签图层文本改成红色
const customColorCaseExpr = [
    [
        "all",
        [
            "any",
            [
                "==",
                [
                    "get",
                    "type"
                ],
                13
            ],
            [
                "==",
                [
                    "get",
                    "type"
                ],
                12
            ],
            [
                "==",
                [
                    "get",
                    "type"
                ],
                26
            ],
            [
                "==",
                [
                    "get",
                    "type"
                ],
                27
            ]
        ],
        [
            "match",
            [
                "get",
                "layer"
            ],
            [
                24
            ],
            true,
            false
        ]
    ],
    "#ff0000"
]
let newStyle = svc.vectorStyle({
        customColorCaseExpr
});
map.setStyle(newStyle);
1
2
3
4
5
6
7
8
9
10
11
12
13
14
15
16
17
18
19
20
21
22
23
24
25
26
27
28
29
30
31
32
33
34
35
36
37
38
39
40
41
42
43
44
45
46
47
48
49
50
51
52
53
54
55
56
57
2
3
4
5
6
7
8
9
10
11
12
13
14
15
16
17
18
19
20
21
22
23
24
25
26
27
28
29
30
31
32
33
34
35
36
37
38
39
40
41
42
43
44
45
46
47
48
49
50
51
52
53
54
55
56
57
# 黄色的线变色透明加粗
const customColorCaseExpr = [
    [
        "any",
        [
            "==",
            [
                "get",
                "color"
            ],
            "#ffff00"
        ]
    ],
    "#00ffff"
]
let newStyle = svc.vectorStyle({
        customColorCaseExpr
});
map.setStyle(newStyle);
1
2
3
4
5
6
7
8
9
10
11
12
13
14
15
16
17
18
2
3
4
5
6
7
8
9
10
11
12
13
14
15
16
17
18

# 前端个性化地图(栅格瓦片)
对于栅格瓦片图层,可在前端设置图层的地图样式、是否反色、饱和度、对比度
设置图层自定义样式在线示例 (opens new window)
let styleStyle = svc.rasterStyle();
// 初始状态设置样式值
styleStyle.layers[0].paint = {
	...styleStyle.layers[0].paint,
	// 自定义地图样式,用深色来代替默认的样式
	"raster-inverse": 1, //  0不反色 1 反色
	"raster-monochrome": "#4586b6", // // 修改地图样式,用纯色代替
	"raster-saturation": 0, // 饱和度  取值 -1 到 1
	"raster-contrast": 0, // 对比度   取值 -1 到 1
}
// 地图对象
let map = new vjmap.Map({
	container: 'map', // DIV容器ID
	style: styleStyle, // 样式,这里是栅格样式
	center: prj.toLngLat(prj.getMapExtent().center()), // 设置地图中心点
	zoom: 2, // 设置地图缩放级别
	renderWorldCopies: false // 不显示多屏地图
});
// 关联服务对象和投影对象
map.attach(svc, prj);
await map.onLoad()
let layerId = "raster-layer"
// 反色
//map.setRasterInverse(layerId, 1) // 0不反色 1 反色
// 纯色
//map.setRasterMonochrome(layerId, "#4586b6")
// 饱和度
// map.setRasterSaturation(layerId, 0) // 取值 -1 到 1
// 对比度
// map.setRasterContrast(layerId, 0) // 取值 -1 到 1
// 明亮度最大值
//  map.setRasterBrightnessMin(layerId, 0.5) // 取值 0 到 1
// 明亮度最大值
//  map.setRasterBrightnessMax(layerId, 1) // 取值 0 到 1
1
2
3
4
5
6
7
8
9
10
11
12
13
14
15
16
17
18
19
20
21
22
23
24
25
26
27
28
29
30
31
32
33
34
2
3
4
5
6
7
8
9
10
11
12
13
14
15
16
17
18
19
20
21
22
23
24
25
26
27
28
29
30
31
32
33
34
