# Map-Related Concepts
# Map Service (Service)
The VJMap service is primarily used to load and parse AutoCAD DWG files and image files such as tiff, then publish them as GIS services. It provides WMS or WMTS services for both raster tiles and vector tiles, along with spatial data query capabilities, overlay with internet maps, and create/modify operations on CAD drawings.
# Map
In the VJMap vjmap SDK, the Map is the core object that displays the map on the web page and controls user interaction. It is not only for loading and displaying CAD drawings as a base map, but also a highly dynamic visualization tool that users can interact with through operations such as dragging, zooming, and rotating.
Each map can contain multiple layers (Layers). These layers display data in different forms—polygons, polylines, point symbols, custom markers, etc. Map styles can be defined in JSON format, allowing users to customize visual elements such as colors, opacity, and fonts.
# Key Properties:
- Style: Defines the map's appearance, including layer order, colors, fonts, etc.
- Center: The initial display position of the map, usually determined by longitude and latitude coordinates.
- Zoom: Controls the map zoom level; higher values show more detail.
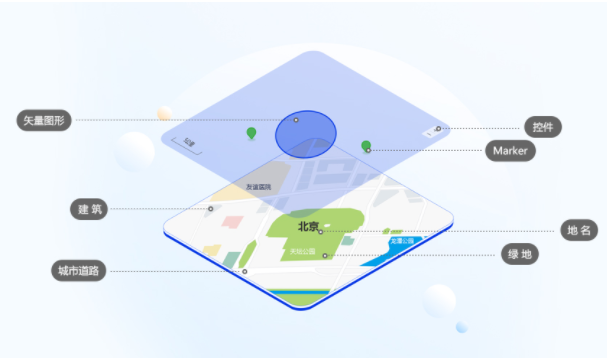
The diagram below shows the structure of a map. It helps you understand the map and quickly grasp the Map JS API functionality.
# Data Source (Source)
Data sources are the foundation of the map. They provide geographic data for the layers on the map. The VJMap vjmap SDK supports multiple data source types. Each type can serve different kinds of spatial data, such as vector tiles, raster tiles, or GeoJSON data.
Data sources are categorized as follows:
- Vector Source: Contains geographic information in vector format based on CAD drawings. Vector data maintains high display quality at different zoom levels.
- Raster Source: Raster data consists of pixels and cannot be scaled losslessly like vector data, but it is suitable for image-based data.
- GeoJSON Source: GeoJSON is a JSON-based geographic data standard that describes geographic features and their attributes. It is ideal for dynamically adding and managing small-scale geographic datasets.
- Image Source: Allows static images to be overlaid on the map as layers, commonly used for custom map markers or annotations.
# Layer
Layers determine how data is displayed on the map. Each layer is associated with one or more data sources and controls how that data is rendered on the map. Layers are core components of the map and can be stacked, hidden, or modified to flexibly adjust the map's appearance.
Layer types include:
- Fill Layer: Used to render polygon areas, such as buildings or lakes.
- Line Layer: Used to draw linear features, such as roads or boundaries.
- Symbol Layer: Used to display icons or text labels, suitable for place markers or labels.
- Circle Layer: Used to display circular markers based on point data, often for city locations.
- Raster Layer: Used to display raster images.
- Heatmap Layer: Generates heatmaps based on data density, suitable for showing event frequency or data aggregation.
# How Layers Work:
Each layer can change dynamically based on zoom level, map extent, and other conditions. When the user interacts or changes the map view or zoom, the layer display updates accordingly. For example, at low zoom levels the map may only show country boundaries, but when zoomed in it shows roads and buildings.
# Style
Style refers to the visual design of the map, including background color, fonts, icons, line thickness, etc. The VJMap vjmap SDK uses JSON files to define map styles, called style files. Each style file defines the overall layout and how data is extracted from sources and applied to different layers.
# Style Components:
- Version: The version of the style.
- Source: Defines all data sources used in the map.
- Layers: Defines how source content is displayed on the map.
# Coordinate System and Projection
Map projection refers to the transformation and mapping of longitude/latitude coordinates on the Earth's surface to map plane coordinates. The map uses Web Mercator projection and also supports longitude/latitude projection.
# Interactions
The VJMap vjmap SDK provides a set of interaction features that allow users to drag, zoom, rotate, and otherwise manipulate the map. These features make the map interactive rather than a static display.
# Common Interactions:
- Drag: Users can drag the map to change the view and explore different areas.
- Zoom: Users can zoom in or out using the mouse wheel or double-click to see different levels of detail.
- Rotate: Users can rotate the map via touch or mouse to view it from different angles.
- Pitch: Allows users to change the viewing angle for a tilted view of 3D buildings or terrain.
Developers can enable or disable these interactions as needed to control the user experience.
# Dynamic Data and Events
The VJMap vjmap SDK allows developers to dynamically load and update map data for real-time updates. For example, new markers or layers can be added via the API, or real-time location data can be loaded from external sources.
The map can also respond to user events such as click, drag, and zoom. By listening to these events, developers can build interactive applications such as popups and real-time data display.
# Map Container
The div element with a specified id created during setup. This div serves as the container for all layers, point markers, vector graphics, and controls.
# Vector Layer
Choose a map style or fully customize your own map and data. The map renders at high frame rates for smooth response to user input or script events.
# Vector Graphics
Vector graphics are typically placed above the base layers. They describe shapes using vectors (paths or actual sizes) and represent real map features geometrically. Their visual size changes with map zoom, but the actual path or extent they represent stays the same—examples include polylines, circles, and polygons in the red box in the diagram above.
# Raster Layer
The map provides raster layer rendering APIs for satellite imagery, hillshade, custom tile maps, and more.
# Point Marker
Point markers indicate location information on the map and are placed above layers. They are shown in the blue box in the diagram. Their position on the screen changes with map zoom and center, but their position relative to other elements remains stable.
Standard point markers (Marker) support custom icons and DOM elements as content. The Map JS API also provides other point marker types for different scenarios, such as circle markers and text markers. Mass point and point clustering are available for large numbers of point markers.
# Popup
Popups describe detailed information for a location. They are placed above layers and support position offset and display direction adjustment.
Popups are ultimately rendered as DOM elements. Support includes custom DOM content and custom event bindings for elements inside the popup.
# Geometry Editing (Draw)
The map provides geometry editing for points, lines, polygons, circles, ellipses, sectors, curved polygons, complex arrows, etc. It supports secondary editing of shapes and provides APIs to obtain geometry after editing.
# Map Control
Controls float above all layers and map elements to provide interaction or display information. They are usually fixed relative to the map container and do not move with zoom or center changes.
# Common Terms
# Map Level
Level is proportional to map scale. Each increase adds one level and doubles the scale, showing more detail.
# GeoPoint (Geometric Coordinates)
Refers to coordinates on the CAD drawing.
# LngLat (Longitude and Latitude)
Coordinates usually refer to longitude and latitude. The approximate range is: longitude from -180 to 180 (west negative, east positive), latitude from -85 to 85 (north positive, south negative).
# Point (Pixel Coordinates)
Refers to pixel coordinates on the device screen.
# Base Map
Strictly speaking, the base map is the layer at the bottom of all layers and graphics.
# Feature
A map feature in the strict sense is a geographic element displayed on the map. Custom markers and vector graphics can also be considered map features.
# Annotation
Text or icons on the base map that indicate information are commonly called annotations, such as POI labels.
# Internet Map
Refers to maps that provide internet map services, such as Tianditu, Amap, Baidu Map, OSM, etc.