# Cesium and CAD Overlay Display
Cesium is an excellent 3D Earth GIS engine, open source and free. It can load various standard map layers, including tile maps, vector maps, and more. In practice, there is often a need to overlay CAD drawings on Cesium and display them together with terrain. So how do you overlay and analyze CAD DWG drawings in Cesium?
# Technical Analysis
The common industry approach is:
- (1) Export DWG to DXF plain text format in AutoCAD
- (2) Use third-party tools such as GDAL to convert DXF to GIS formats like SHP
- (3) Use open-source GIS services such as GeoServer or MapServer to publish SHP files as GIS services
- (4) Load GIS service tile layers in Cesium
The advantages of the above approach are obvious—basically the workflow can be completed using open-source solutions. But in actual projects the disadvantages are also clear, mainly in steps (1) and (2). Because DWG is a proprietary format, converting DWG to DXF and then to SHP loses much of the data in the drawing. CAD supports many data types: points, block symbols, lines, polygons, polylines, ellipses, blocks, text, etc. When converting to GIS, these become only points, lines, polygons, and annotations. This makes CAD graphic data unable to fully meet GIS requirements. For example, CAD Text data is converted only to GIS Point type. Drawing from such conversions can differ from the original CAD drawing. In addition, CAD line types and fonts can cause rendering differences.
VJMap fully supports AutoCAD DWG format files. No conversion is needed; they can be published directly as GIS WMS format, effectively solving the above problems. The implementation steps are:
- (1) Upload DWG drawings and publish them as WMS layers using VJMap
- (2) Load WMS tile layers in Cesium
# Implementation
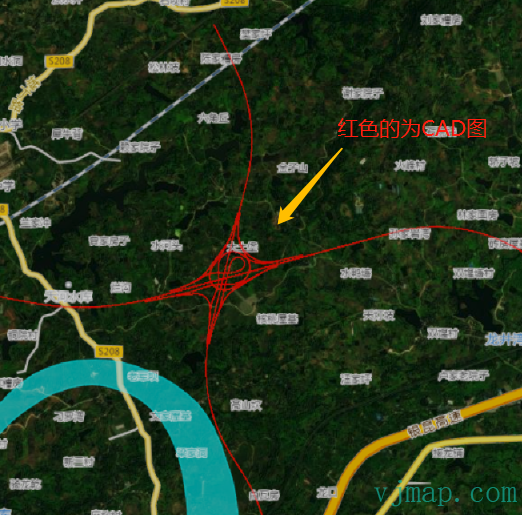
First, the effect (red lines are the CAD layer):

# Steps:
Determine the CAD drawing coordinate system
In the opened CAD drawing, pick any point. The coordinates are "614802.89177, 3257472.36997"
How do you determine which coordinate system this belongs to? If you already know the coordinates, can you infer the coordinate system?
You can use the Determining Coordinate System from CAD Coordinates tool. Or use the following method. Here we only discuss Gauss-Krüger projection.
Assuming the projection is known to be Gauss-Krüger, how do you determine whether it is 6° or 3° zone? How do you determine the central meridian?
If the coordinate range has 6 digits, the coordinate system likely has no zone number. If the Y value is in the range 333000m–667000m, it may be 3° zone; if Y is in 166000m–834000m, it is definitely 6° zone. If the range overlaps, it could be either 3° or 6° zone.
If the coordinate range has 8 digits, the coordinate system uses zone numbers. Based on the zone number you can tell 3° or 6° zone. China's longitude is roughly 73°33′E–105°05′E, so if zone numbers are used: zone numbers 13–23 indicate 6° zone; zone numbers 25–45 indicate 3° zone.
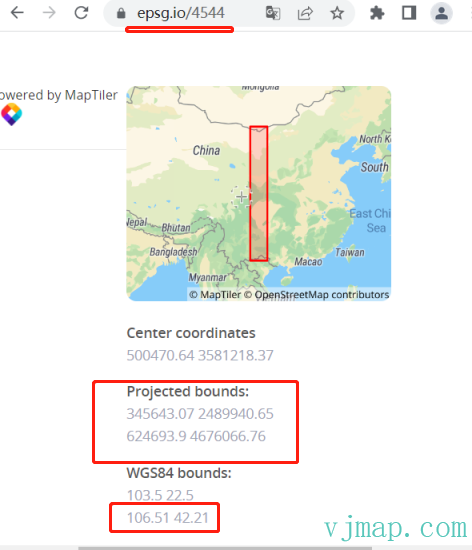
In this drawing, the coordinate "614802" has 6 digits, so it is likely a 3° zone coordinate with the zone number omitted. The map frame indicates the 2000 coordinate system, and the location is near Chongqing. Chongqing's longitude is around 106. Querying the EPSG website shows this coordinate system should be "EPSG:4544".
Upload and open the CAD drawing
Upload the CAD drawing at VJMap Cloud Drawing Management Platform (opens new window).
Add the CAD layer in Cesium
let imageryProvider= new Cesium.WebMapTileServiceImageryProvider({
			url: "http://t0.tianditu.gov.cn/img_w/wmts?tk=3346bb6ad29b5013c5952cf1117b80e9",
			layer: "img",
			style: "default",
			tileMatrixSetID: "w",
			format: "tiles",
			maximumLevel: 14,
		});

		let viewer = new Cesium.Viewer('cesiumContainer', {
			imageryProvider: imageryProvider,
			contextOptions: {
				webgl: {
					alpha: true
				}
			},
			selectionIndicator: false,
			animation: false, // show animation widget
			baseLayerPicker: false, // show layer picker
			geocoder: false, // show geocoder
			timeline: false, // show timeline
			sceneModePicker: false, // show scene mode picker
			navigationHelpButton: false, // show navigation help
			infoBox: false, // show click info box
			fullscreenButton: false,
			shouldAnimate: true // animate
		});

		var layers = viewer.scene.imageryLayers;

		layers.addImageryProvider(
			new Cesium.WebMapServiceImageryProvider({
			    // Load CAD via vjmap WMS
				url: `https://vjmap.com/server/api/v1/map/cmd/wms/
sys_cadcesium/v1?mapbounds=&format=image/png&service=WMS&version=1.1.1&request=GetMap&srs=EPSG:4326&transparent=true&width=256&height=256&layers=se92105f73&crs=EPSG:4544&fourParameter=&token=your token`,
			})
		);
1
2
3
4
5
6
7
8
9
10
11
12
13
14
15
16
17
18
19
20
21
22
23
24
25
26
27
28
29
30
31
32
33
34
35
36
37
The code above seems straightforward, but in practice it was found that in Cesium the CAD can overlay with Tianditu imagery. However, when zooming in, the WMS-generated tiles had misalignment issues, as shown below:

# Problem Analysis
In Cesium, the coordinate system is WGS84, while the CAD drawing uses EPSG:4544. Conversion between two different ellipsoids in WMS tile generation is based on coordinate transformation. Because coordinate transformation is nonlinear, the generated image content cannot align perfectly. Hence the misalignment.
How to fix it?
The final solution is:
First, use four-parameter transformation to compute the conversion parameters between CAD and Mercator 3857
Then convert Mercator 3857 to WGS84
With this approach, the data conversion becomes linear, eliminating the misalignment.
Code:
// Load CAD in Cesium (WMS layer)
// Map service
let svc = new vjmap.Service(env.serviceUrl, env.accessToken)
// Open map
let mapId = "sys_cadcesium";
let res = await svc.openMap({
    mapid: mapId, // map ID
    mapopenway: vjmap.MapOpenWay.GeomRender, // geometry render
    style: vjmap.openMapDarkStyle() // use dark style when container has dark background
})
if (res.error) {
    // open failed
    message.error(res.error)
}
let layer = res.layer;// style layer name

let mapBounds = vjmap.GeoBounds.fromString(res.bounds);
let boundsArray = mapBounds.toPointArray();

// Mercator points after transform
let mktPoints = await svc.cmdTransform("EPSG:4544", "EPSG:3857", boundsArray.map(a => vjmap.geoPoint(a)));
// CAD point coords
let cadPoints = [...boundsArray];
// Solve four-parameter from point pairs
let fourparam = vjmap.coordTransfromGetFourParamter(
    mktPoints.map(a => vjmap.geoPoint(a)),
    cadPoints.map(a => vjmap.geoPoint(a)),
    true
);

if (typeof Cesium !== "object") {
    // Load Cesium if not present
    await vjmap.addScript([{
        src: "js/Cesium/Cesium.js"
    }, {
        src: "js/Cesium/Widgets/widgets.css"
    }])
}

let imageryProvider= new Cesium.WebMapTileServiceImageryProvider({
    url: "https://t0.tianditu.gov.cn/img_w/wmts?tk=3346bb6ad29b5013c5952cf1117b80e9",
    layer: "img",
    style: "default",
    tileMatrixSetID: "w",
    format: "tiles",
    maximumLevel: 14,
});

let viewer = new Cesium.Viewer('map', {
    imageryProvider: imageryProvider,
    contextOptions: {
        webgl: {
            alpha: true
        }
    },
    selectionIndicator: false,
    animation: false, // show animation widget
    baseLayerPicker: false, // show layer picker
    geocoder: false, // show geocoder
    timeline: false, // show timeline
    sceneModePicker: false, // show scene mode picker
    navigationHelpButton: false, // show navigation help
    infoBox: false, // show click info box
    fullscreenButton: false,
    shouldAnimate: true // animate
});


var layers = viewer.scene.imageryLayers;

// Add Amap annotation layer
layers.addImageryProvider(
    new Cesium.UrlTemplateImageryProvider({
        url: "https://webst02.is.autonavi.com/appmaptile?x={x}&y={y}&z={z}&lang=zh_cn&size=1&scale=1&style=8",
    })
);


// Add CAD WMS layer
let wmsUrl = svc.wmsTileUrl({
    mapid: mapId, // map id
    layers: layer, // layer name
    bbox: '', // Cesium fills bbox automatically
    srs: "EPSG:4326", // Cesium is WGS84
    crs: "EPSG:3857", // WGS84 -> 3857 first
    fourParameter: [fourparam.dx,fourparam.dy,fourparam.scale,fourparam.rotate] // then four-param to CAD
})
layers.addImageryProvider(
    new Cesium.WebMapServiceImageryProvider({
        url: wmsUrl,
    })
);


// CAD coords -> WGS84
const cadToWebCoordinate = point => {
    // Four-param inverse to Mercator 3857, then 3857 -> WGS84
    // Inverse needed: four-param above is 3857->CAD; here we need CAD->3857
    let ptMkt = vjmap.coordTransfromByInvFourParamter(vjmap.geoPoint(point), fourparam);
    return vjmap.Projection.mercator2LngLat(ptMkt);// Mercator 3857 -> lng/lat
}
// WGS84 -> CAD coords
const webTocadCoordinate = point => {
    // WGS84 -> Mercator 3857, then four-param to CAD
    let ptMkt = vjmap.Projection.lngLat2Mercator(vjmap.geoPoint(point));
    return vjmap.coordTransfromByFourParamter(ptMkt, fourparam);
}
// CAD center -> WGS84 center
let cadCenter = mapBounds.center();
let webCenter = cadToWebCoordinate(cadCenter);
// Set initial camera
viewer.camera.flyTo({
    destination: Cesium.Cartesian3.fromDegrees(webCenter[0], webCenter[1], 30000)
});

// To query CAD entities by map coords, use svc.rectQueryFeature with a CAD bounds (two corner points).
// Use webTocadCoordinate to convert WGS84 to CAD coords for the query.
1
2
3
4
5
6
7
8
9
10
11
12
13
14
15
16
17
18
19
20
21
22
23
24
25
26
27
28
29
30
31
32
33
34
35
36
37
38
39
40
41
42
43
44
45
46
47
48
49
50
51
52
53
54
55
56
57
58
59
60
61
62
63
64
65
66
67
68
69
70
71
72
73
74
75
76
77
78
79
80
81
82
83
84
85
86
87
88
89
90
91
92
93
94
95
96
97
98
99
100
101
102
103
104
105
106
107
108
109
110
111
112
113
114
115
116
117
118For data confidentiality, the CAD drawing was desensitized. The overlay effect is as follows:
Visit https://vjmap.com/demo/#/demo/map/web/07cesiumCadWmsLayer (opens new window) to see the effect and code