# Drawing Annotations
Drawing annotations are an important part of drawing review work. The following describes how to implement online web-based drawing annotation functionality.
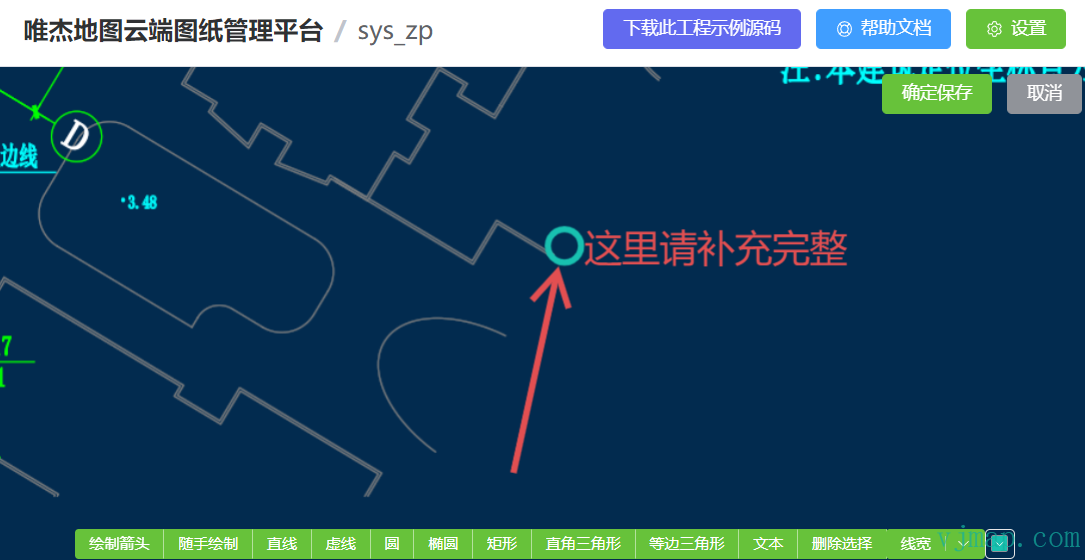
# Implementation Preview
# Drawing Annotation Approach Comparison
Drawing annotation functionality, as a layer for displaying drawings on the web, can generally be implemented in two ways: overlaying annotation content onto the map layer through vector graphics drawing or SVG graphics. The pros and cons of both approaches are as follows:
Vector Graphics Drawing:
Advantages: High performance, good overlay effect, supports infinite zoom without distortion;
Disadvantages: Limited editing capabilities, limited content expression
SVG Graphics:
Advantages: Strong editing capabilities, rich content expression
Disadvantages: Large numbers of SVG graphics can cause performance degradation, distortion at certain zoom levels
Summary: Given that drawing annotation requirements emphasize rich content expression while typically not involving very large data volumes, the SVG graphics overlay approach is a good choice.
# Drawing Annotation Implementation
# SVG Graphics Editing Library Selection
The SVG graphics editing library used is Fabric.js, an open-source library on GitHub with over 22k stars.
Fabric.js is a powerful and concise canvas library. It provides a series of APIs for manipulating canvas, making it easy to work with canvas. It also provides SVG to canvas and canvas to SVG parsers.
Fabric.js official site: http://fabricjs.com/ , GitHub repository: https://github.com/fabricjs/fabric.js
# Drawing Annotation Code
//Drawing method
    function drawing() {
        if (drawingObject) {
            canvas.remove(drawingObject);
        }
        var canvasObject = null;
        switch (drawType) {
            case "arrow": //arrow
                canvasObject = new fabric.Path(drawArrow(mouseFrom.x, mouseFrom.y, mouseTo.x, mouseTo.y, 30, 30), {
                    stroke: strokeColor.value,
                    fill: "rgba(255,255,255,0)",
                    strokeWidth: strokeWidth.value
                });
                break;
            case "line": //line
                canvasObject = new fabric.Line([mouseFrom.x, mouseFrom.y, mouseTo.x, mouseTo.y], {
                    stroke: strokeColor.value,
                    strokeWidth: strokeWidth.value
                });
                break;
            case "dottedline": //dashed line
                canvasObject = new fabric.Line([mouseFrom.x, mouseFrom.y, mouseTo.x, mouseTo.y], {
                    strokeDashArray: [3, 1],
                    stroke: strokeColor.value,
                    strokeWidth: strokeWidth.value
                });
                break;
            case "circle": //circle
                var left = mouseFrom.x,
                    top = mouseFrom.y;
                var radius = Math.sqrt((mouseTo.x - left) * (mouseTo.x - left) + (mouseTo.y - top) * (mouseTo.y - top)) / 2;
                canvasObject = new fabric.Circle({
                    left: left,
                    top: top,
                    stroke: strokeColor.value,
                    fill: "rgba(255, 255, 255, 0)",
                    radius: radius,
                    strokeWidth: strokeWidth.value
                });
                break;
            case "ellipse": //ellipse
                var left = mouseFrom.x,
                    top = mouseFrom.y;
                var radius = Math.sqrt((mouseTo.x - left) * (mouseTo.x - left) + (mouseTo.y - top) * (mouseTo.y - top)) / 2;
                canvasObject = new fabric.Ellipse({
                    left: left,
                    top: top,
                    stroke: strokeColor.value,
                    fill: "rgba(255, 255, 255, 0)",
                    originX: "center",
                    originY: "center",
                    rx: Math.abs(left - mouseTo.x),
                    ry: Math.abs(top - mouseTo.y),
                    strokeWidth: strokeWidth.value
                });
                break;
            case "rectangle": //rectangle
                var path =
                    "M " +
                    mouseFrom.x +
                    " " +
                    mouseFrom.y +
                    " L " +
                    mouseTo.x +
                    " " +
                    mouseFrom.y +
                    " L " +
                    mouseTo.x +
                    " " +
                    mouseTo.y +
                    " L " +
                    mouseFrom.x +
                    " " +
                    mouseTo.y +
                    " L " +
                    mouseFrom.x +
                    " " +
                    mouseFrom.y +
                    " z";
                canvasObject = new fabric.Path(path, {
                    left: left,
                    top: top,
                    stroke: strokeColor.value,
                    strokeWidth: strokeWidth.value,
                    fill: "rgba(255, 255, 255, 0)"
                });
                //Can also use fabric.Rect
                break;
            case "rightangle": //right triangle
                var path = "M " + mouseFrom.x + " " + mouseFrom.y + " L " + mouseFrom.x + " " + mouseTo.y + " L " + mouseTo.x + " " + mouseTo.y + " z";
                canvasObject = new fabric.Path(path, {
                    left: left,
                    top: top,
                    stroke: strokeColor.value,
                    strokeWidth: strokeWidth.value,
                    fill: "rgba(255, 255, 255, 0)"
                });
                break;
            case "equilateral": //equilateral triangle
                var height = mouseTo.y - mouseFrom.y;
                canvasObject = new fabric.Triangle({
                    top: mouseFrom.y,
                    left: mouseFrom.x,
                    width: Math.sqrt(Math.pow(height, 2) + Math.pow(height / 2.0, 2)),
                    height: height,
                    stroke: strokeColor.value,
                    strokeWidth: strokeWidth.value,
                    fill: "rgba(255,255,255,0)"
                });
                break;
            case "text":
                textbox = new fabric.Textbox("", {
                    left: mouseFrom.x - 60,
                    top: mouseFrom.y - 20,
                    width: 150,
                    fontSize: 30,
                    borderColor: "yellow",
                    fill: strokeColor.value,
                    hasControls: true
                });
                canvas.add(textbox);
                textbox.enterEditing();
                textbox.hiddenTextarea.focus();
                break;
            case "remove":
                break;
            default:
                break;
        }
        if (canvasObject) {
            canvas.add(canvasObject);
            drawingObject = canvasObject;
        }
    }
2
3
4
5
6
7
8
9
10
11
12
13
14
15
16
17
18
19
20
21
22
23
24
25
26
27
28
29
30
31
32
33
34
35
36
37
38
39
40
41
42
43
44
45
46
47
48
49
50
51
52
53
54
55
56
57
58
59
60
61
62
63
64
65
66
67
68
69
70
71
72
73
74
75
76
77
78
79
80
81
82
83
84
85
86
87
88
89
90
91
92
93
94
95
96
97
98
99
100
101
102
103
104
105
106
107
108
109
110
111
112
113
114
115
116
117
118
119
120
121
122
123
124
125
126
127
128
129
130
131
132
133
134
# SVG Graphics Overlay on Map
The vjmap SDK provides a DivOverlay class that creates a div overlay within a geographic bounds that scales with zoom. Its type definition is as follows:
/**
 * Create a div overlay within a geographic bounds that scales with zoom
 * Note: For SVG, set viewBox="0 0 width height" preserveAspectRatio="xMinYMin meet", and set updateDivSize option to true
 **/
export  class DivOverlay {
    options: DivOverlayOptions;
    _map?: Map;
    isShow: boolean;
    minZoom: number;
    maxZoom: number;
    isRemoved: boolean;
    parentContainer?: HTMLElement;
    constructor(options: DivOverlayOptions);
    addTo(map: Map, insertId?: string | HTMLElement): void;
    private _isShow;
    private _add;
    private _remove;
    /**
     * Set visibility
     * @param visible Whether to show
     * @param isDisplay If true, use style display to control visibility; dom remains in document. If false, dynamically add/remove from document
     */
    setVisible(visible?: boolean, isDisplay?: boolean): void;
    remove(): void;
    updateBounds(bounds: [GeoPointLike, GeoPointLike, GeoPointLike, GeoPointLike] | GeoBounds): void;
    updateSize(width: number, height: number): void;
    private _updateZoom;
    private _updateDivSize;
    private _adjustCoord;
    private _update;
}

export  interface DivOverlayOptions {
    /** Bounds, four corner coordinates */
    bounds: [GeoPointLike, GeoPointLike, GeoPointLike, GeoPointLike] | GeoBounds;
    /** HTML element */
    element: HTMLElement;
    /** Element width */
    width: number;
    /** Element height */
    height: number;
    /** Maximum zoom level to display */
    minZoom?: number;
    /** Minimum zoom level to display */
    maxZoom?: number;
    /** Auto-update div size (set to true if SVG needs to scale) */
    updateDivSize?: boolean;
    /** Maximum div size when scaling, beyond which pixel scaling is used */
    maxDivSize?: number;
}
2
3
4
5
6
7
8
9
10
11
12
13
14
15
16
17
18
19
20
21
22
23
24
25
26
27
28
29
30
31
32
33
34
35
36
37
38
39
40
41
42
43
44
45
46
47
48
49
50
Export the graphics drawn in Fabric.js as SVG, then overlay them onto the map via DivOverlay. Related code:
 export const createDivSvg = (map: Map, eleId: string, pt1: GeoPoint, pt2: GeoPoint, width: number, height: number, svg: string) => {
    svg = svg.substring(svg.indexOf("<desc>"));
    const div = document.createElement( "div" );
    div.id = eleId;
    div.innerHTML = `
        <svg viewBox="0 0 ${width} ${height}" preserveAspectRatio="xMinYMin meet" version="1.1" xmlns="http://www.w3.org/2000/svg">
            ${svg}
        </svg>
    `;
    div.style.position = 'absolute';
    div.style.pointerEvents = "none"
    div.style.width = width + "px";
    div.style.height = height + "px";
    //div.style.opacity = '0.8';

    const divOverlay = new DivOverlay({
        bounds: [[pt1.x, pt2.y], [pt1.x, pt1.y], [pt2.x, pt1.y], [pt2.x, pt2.y]],
        element: div,
        width: width,
        height: height,
        updateDivSize: true // Add this parameter if SVG needs to scale
    })
    divOverlay.addTo(map);
    return divOverlay;
}
let center = map.getCenter();
let anno = {
    mapId: app.curMapId,
    version: app.curVersion,
    name: name,
    darkTheme: svc.currentMapParam()?.darkMode === true ? true : false,
    imgSrc: img,
    zoom: map.getZoom(),
    centerX: center.lng,
    centerY: center.lat,
    bearing: map.getBearing(),
    pitch: map.getPitch(),
    id: id,
    pt1: canvasCoord1,
    pt2: canvasCoord2,
    width: canvasWidth,
    height: canvasHeight,
    svg: fabricCanvas.toSVG(),
    json: fabricCanvas.toJSON(),
}
// Add divSvg
let divOverlay = createDivSvg(map, id, canvasCoord1, canvasCoord2, canvasWidth, canvasHeight, anno.svg);
2
3
4
5
6
7
8
9
10
11
12
13
14
15
16
17
18
19
20
21
22
23
24
25
26
27
28
29
30
31
32
33
34
35
36
37
38
39
40
41
42
43
44
45
46
47
48
The case code above is open source. Visit (VJMap Cloud Drawing Management Platform (opens new window) https://vjmap.com/app/cloud) and click Download Case Source Code to get it.