# Style Specification
The style specification is a document that defines the visual appearance of the map: what data to draw, the drawing order, and how to style the data when drawing it.
A style has the following root properties:
- Descriptive information:
version,metadata - Map state:
center,bearing,pitch - Map elements:
sources,layers - Others:
sprite,glyphs,light,transition
{
  'version': number, // Version number
  'name': 'string', // Style name
  'sprite': 'string', // Sprite
  'glyphs': '***/{fontstack}/{range}.pbf', // Fonts
  'sources': {}, // Data sources
  'layers': [] // Layers
}
2
3
4
5
6
7
8
# Data Sources
sources
Data source type is specified by type, and must be one of vector, raster, raster-dem, geojson, image, video.
Note
There is also a canvas type, which is an extension of image: CanvasSource
# vector
Layers using vector data sources must specify source-layer.
'sources': {
  '{source-id}': {
    'type': 'vector',
    'tiles': [
      'http://a.example.com/tiles/{z}/{x}/{y}.pbf'
    ],
    'bounds': [-180, -85.051129, 180, 85.051129]
  },
  '{source-id}': {
    'type': 'vector',
    'url': 'http://api.example.com/tilejson.json'
  },
  '{source-id}', {
    'type': 'vector',
    'url': 'xxx'
  },
}
2
3
4
5
6
7
8
9
10
11
12
13
14
15
16
17
# raster
'sources': {
  '{source-id}': {
    'type': 'raster',
    'tiles': [
      'http://xxx&x={x}&y={y}&l={z}&tk={key}',
      'http://xxx&x={x}&y={y}&l={z}&tk={key}'
    ],
    'tileSize': 256
  },
}
2
3
4
5
6
7
8
9
10
# raster-dem
Raster DEM data source. Can be generated using rio-rgbify (opens new window).
# fill no data
gdalwarp -t_srs EPSG:3857 -dstnodata None -co TILED=YES -co COMPRESS=DEFLATE -co BIGTIFF=IF_NEEDED E:\xxx.tif  E:\xxxx.tif

# conver to rgb
rio rgbify -b -10000 -i 0.1 E:\xxxx.tif E:\test\xxx.tif
2
3
4
5
# geojson
GeoJSON data source. Must provide data property. Can set cluster, filter, etc.
'sources': {
  // inline GeoJSON
  'geojson-marker': {
    'type': 'geojson',
    'data': {
      'type': 'Feature',
      'geometry': {
        'type': 'Point',
        'coordinates': [-77.0323, 38.9131]
      },
      'properties': {
        'title': 'xxx',
        'marker-symbol': 'monument'
      }
    }
  },
  // url
  'geojson-lines': {
    'type': 'geojson',
    'data': './lines.geojson'
  }
}
2
3
4
5
6
7
8
9
10
11
12
13
14
15
16
17
18
19
20
21
22
# image & video
See Data/Raster.
# GeoServer
# TMS
Standard: Tile Map Service (opens new window)
Tile Map Service, abbreviated as TMS. The TMS tile coordinate system and organization can be referenced in the figure below:
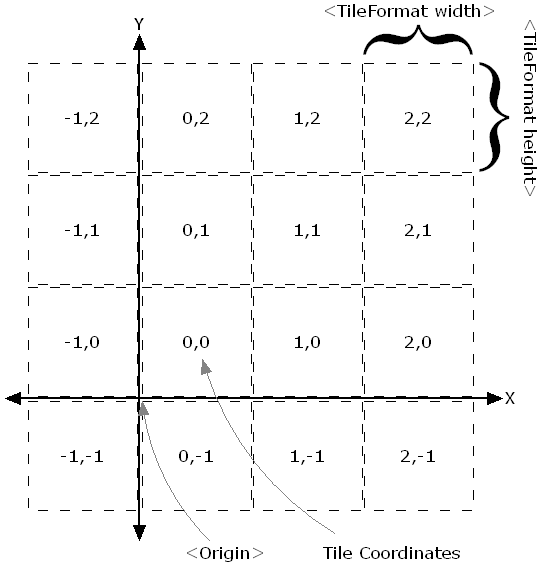
When loading TMS services, set the scheme property to tms. The scheme property affects the direction of the tile coordinate y axis. scheme has two optional values: xyz (default) and tms. xyz represents the common tile rule, i.e., OGC standard, with tile origin at top-left. tms is the OSGeo standard, with tile origin at bottom-left.
Loading example:
// Vector
'source-id': {
  'type': 'vector',
  'tiles': [
    'https://xxx@pbf/{z}/{x}/{y}.pbf'
  ],
  'scheme': 'tms'
}
// Raster
'source-id': {
  'type': 'raster',
  'tiles': [
    'https://xxx@png/{z}/{x}/{y}.png'
  ],
  'tileSize': 256,
  'scheme': 'tms'
}
2
3
4
5
6
7
8
9
10
11
12
13
14
15
16
17
# WMS
Standard: Web Map Service (opens new window)
Web Map Service, abbreviated as WMS. The WMS standard defines operations that allow users to render maps and perform other operations on spatial data via HTTP. WMS services include the following 3 operations:
- GetCapabilities (get feature classes and supported operations in the service)
- GetMap (get map)
- GetFeatureInfo (get more detailed feature information based on pixel points on the map, similar to Identify function)
Use the GetMap operation with specified map bounding box (bbox) and output format (format).
Loading example (image/png format):
'source-id': {
  'type': 'raster',
  'tiles': [
    'https://xxx?service=WMS&version=1.3.0&request=GetMap&layers=china:bj&bbox={bbox-epsg-3857}&width=512&height=512&srs=EPSG:3857&format=image/png&TRANSPARENT=TRUE'
  ]
}
2
3
4
5
6
Note the bbox parameter value "{bbox-epsg-3857}" in the URL. The map will automatically calculate the map extent and replace this value to fetch the map. This is also why WMS does not appear blurry compared to WMTS below when using raster format.
# WMTS
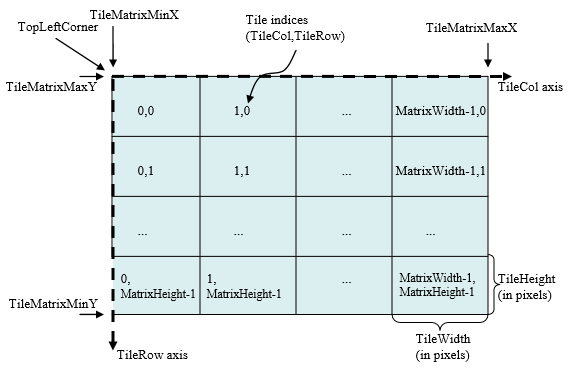
Standard: Web Map Tile Service (opens new window)
Web Map Tile Service, abbreviated as WMTS. The WMTS standard defines operations that allow users to access tile maps. WMTS services include the following 3 operations:
- GetCapabilities (get service metadata)
- GetTile (get tiles)
- GetFeatureInfo (optional, get feature information for point selection)
The WMTS tile coordinate system and organization can be referenced in the figure below:
Use the GetTile operation with specified output format.
Loading example (image/png format):
'source-id': {
  'type': 'raster',
  'tiles': [
    'https://xxx/service/wmts?REQUEST=GetTile&SERVICE=WMTS&VERSION=1.0.0&LAYER=buildings:Chongqing&STYLE=&TILEMATRIX=EPSG:900913:{z}&TILEMATRIXSET=EPSG:900913&FORMAT=image/png&TILECOL={x}&TILEROW={y}'
    // or geoserver rest service
    // 'https:/xxx/wmts/rest/buildings:Chongqing/EPSG:900913/EPSG:900913:{z}/{y}/{x}?format=image/png'
  ]
}
2
3
4
5
6
7
8
Note
Requesting raster format (e.g. image/png) data this way may appear somewhat blurry. Setting 'tileSize': 256 improves this. However, the actual WMTS request returns clear images. The blurriness is because map zoom is continuous (zoom can be decimal), while WMTS z values are integers, and scaling occurs during rendering.
As mentioned earlier, loading WMS does not appear blurry because WMS actually renders in real-time based on the request extent, but loading speed is not as fast as tile services.
Loading example
'source-id': {
  'type': 'vector',
  'tiles': [
    // geoserver rest service
    // 'https://xxx/wmts/rest/buildings:Chongqing/EPSG:900913/EPSG:900913:{z}/{y}/{x}
  ]
}
2
3
4
5
6
7
# WFS
Standard: Web Feature Service (opens new window)
Web Feature Service, abbreviated as WFS. The WFS standard defines operations that allow users to query, edit, and perform other operations on spatial data via HTTP. Common WFS operations include:
- GetCapabilities (get feature classes and supported operations in the service)
- DescribeFeatureType (describe feature class information)
- GetFeature (get features)
- Transaction (transaction operations for create, update, delete data)
Use the GetFeature operation with specified output format.
Loading example (application/json format):
'source-id': {
  'type': 'geojson',
  'data': `https://xxx?service=WFS&version=2.0.0&request=GetFeature&typeName=buildings:cq_point&outputFormat=application/json`
}
2
3
4
Note
- WFS requests all data and is not suitable for large datasets. However, it supports spatial and attribute queries and is often used.
- Documentation: wfs/wms filter (opens new window)
# Layers
layers
Layer property configuration:
| Property | Type | Required | Description |
|---|---|---|---|
id | string | Yes | Unique layer identifier |
type | string | Yes | Layer type |
source | string | No | Data source name, required for all layer types except background |
source-layer | string | No | Layer name, required for vector tile sources (vector), not available for other types |
minzoom | number | No | Minimum zoom level for layer |
maxzoom | number | No | Maximum zoom level for layer |
filter | expression | No | Filter |
layout | object | No | Layer layout properties |
paint | object | No | Layer paint properties |
metadata | any | No | Arbitrary properties, useful for layer tracking, does not affect rendering |
Layer example:
'layers': [
  {
    'id': 'road',
    'type': 'line',
    'source': 'your source',
    'source-layer': 'road',
    'minzoom': 7,
    'maxzoom': 18,
    'layout': {
      'visibility': 'visible'
    },
    'paint': {
      'line-color': 'hsl(55, 1%, 20%)'
    },
    'filter': ['==', '$type', 'LineString']
    'metadata': {
      'type': 'base'
    }
  }
]
2
3
4
5
6
7
8
9
10
11
12
13
14
15
16
17
18
19
20
Note
"type"property must be one ofbackground,fill,line,symbol,raster,circle,fill-extrusion,heatmap,hillshade.- Layers other than
backgroundneed to reference a source; layers get data from the source, filter features, and render. layoutproperty hasvisibilityproperty, which can be set to"visible"(default) or"none".- Colors support
hex,RGB,RGBA,HSL,HSLA,HTML predefined color namesformats.
# Expressions
For more details, see: expressions
Any layout property, paint property, or filter value can be an expression. Example:
{
  "circle-radius": [
    "interpolate", ["linear"], ["zoom"],
    // when zoom is 0, set each feature's circle radius to the value of its "rating" property
    0, ["get", "rating"],
    // when zoom is 10, set each feature's circle radius to four times the value of its "rating" property
    10, ["*", 4, ["get", "rating"]]
  ]
}
2
3
4
5
6
7
8
9
Note
In expressions, layout and paint properties have an important difference. For paint properties, values are recalculated whenever the zoom level changes, including fractional changes (e.g. between 4.1 and 4.6). For layout properties, values are only calculated at integer zoom levels; they do not change between 4.1 and 4.6, and are only recalculated when above 5 or below 4.
# Types
Expressions have a powerful type system with conversion and detection support. For example, expression input and output data types must match the types in the style specification; automatic detection occurs during expression evaluation, and errors are logged to the console.
# Feature data
- feature-state: Feature state. Feature state is not a data property; it must be set via feature
id, e.g. to sethoverstate on a feature:map.setFeatureState({source: 'states', id: hoveredStateId}, {hover: false}), then use in expression:['feature-state', 'hover']
# Lookup
- get: Get feature property, e.g. get
nameproperty:['get', 'name']
# Decision
Common conditional logic can be used in expressions. For example, "if/then/else" logic can use the 'case' expression; to map specific input values to different outputs, use the 'match' expression.
# Ramps, scales, curves
- interpolate: Interpolation, supports
linear,exponential, andcubic-bezier - step: Step
# Variable binding
- let: Bind variable
- var: Reference variable bound by
let
# String
- downcase
- upcase
# Color
- rgb
- rgba
# Math
Supports basic math operations, e.g.
['/', ['get', 'gdp'], 1000]
# Zoom
Get current zoom level. Only used as input for step or interpolate expressions.
['zoom']: number
{
      "id": "road",
      "type": "line",
      "source": "a",
      "paint": {
        "line-width": 10,
        "line-pattern": [
          "step", ["zoom"],
          "generic_icon", /*use this line symbol when zoom < 2*/
          2,
          "generic_metro" /*use this line symbol when zoom >= 2*/
        ]
      }
    }
2
3
4
5
6
7
8
9
10
11
12
13
14
# Heatmap
Get kernel density estimate for pixels in heatmap layer. Can only be used in heatmap-color property.
['heatmap-density']: number
For more details on style expressions, see: expressions