# Geometric Model
API documentation: https://vjmap.com/docs/geomodel/ (opens new window)
Example code: https://vjmap.com/demo/#/demo/map/models/01geomodels (opens new window)
# Quick Start
# Direct JS Import
<script src="https://vjmap.com/demo/js/vjmap/vjgeo.min.js" type="text/javascript"></script>
# npm
npm install vjgeo
import vjgeo from 'vjgeo'
# Point
A point is represented by an array with 2 elements. The first element is x, the second is y.
var p = [0, 0];
# Coordinates
Uses the same coordinate system as basic mathematics and traditional cartography, where x values increase left to right and y values increase bottom to top. Negative values are allowed.
# Path
A path is represented by an object with the following mandatory properties:
- type: string - "line", "circle", or "arc"
- origin: point
# Line
A line is a path of type "line" with this additional property:
var line = {
  type: 'line',
  origin: [0, 0],
  end: [1, 1]
 };
2
3
4
5
# Circle
var circle = {
 type: 'circle',
 origin: [0, 0],
 radius: 1
};
2
3
4
5
# Arc
var arc = {
  type: 'arc',
  origin: [0, 0],
  radius: 1,
  startAngle: 0,
  endAngle: 45
 };
2
3
4
5
6
7
# Export DWG
Call the vjgeo.exporter.toDWG function and pass your path as a parameter:
var line = {
  type: 'line',
  origin: [0, 0],
  end: [50, 50]
 };
let dwgDoc = vjgeo.exporter.toDWG(line);
2
3
4
5
6
Below is the complete HTML page code. You can copy and save it as index.html for local debugging. Modify the relevant code snippets in the example as needed.
<!DOCTYPE html>
<html lang='en'>
	<head>
		<meta charset='UTF-8'>
		<title>vjmap demo</title>
		<link rel='stylesheet' type='text/css' href='https://vjmap.com/demo/js/vjmap/vjmap.min.css'>
		<script type='text/javascript' src='https://vjmap.com/demo/js/vjmap/vjmap.min.js'></script>
		<script type='text/javascript' src='https://vjmap.com/demo/js/vjmap/vjgeo.min.js'></script>
	</head>
	<body style=' margin: 0;overflow: hidden;background-color:white;font-size: 16px'>
		<div id='map' style='left:0;right:0;top:0;bottom:0;position: absolute;z-index: 0;'></div>
	</body>
	<script>

(async() => {
	document.body.style.background = '#022B4F';
	const env = {
		serviceUrl: 'https://vjmap.com/server/api/v1',
		accessToken: 'eyJhbGciOiJIUzI1NiIsInR5cCI6IkpXVCJ9.eyJJRCI6MSwiVXNlcm5hbWUiOiJyb290MSIsIk5pY2tOYW1lIjoicm9vdDEiLCJBdXRob3JpdHlJZCI6InJvb3QiLCJCdWZmZXJUaW1lIjo4NjQwMCwiZXhwIjoxOTQyMzA1MjQxLCJpc3MiOiJ2am1hcCIsIm5iZiI6MTYyNjk0NDI0MX0.29OAA4Cnjtw780VxIxWqduLtszp1EtpSNHAmWjiL_OM',
	};
	try {
		let svc = new vjmap.Service(env.serviceUrl, env.accessToken);

		const mapBounds = '[-10000,-10000,10000,10000]';
		const mapExtent = vjmap.GeoBounds.fromString(mapBounds);
		const prj = new vjmap.GeoProjection(mapExtent);
		let map = new vjmap.Map({
			container: 'map',
			style: {
				version: svc.styleVersion(),
				glyphs: svc.glyphsUrl(),
				sources: {},
				layers: [],
			},
			center: prj.toLngLat(mapExtent.center()),
			zoom: 2,
			renderWorldCopies: false,
		});
		map.attach(svc, prj);
		await map.onLoad();

        const setDwgDocData = async(strDoc) => {
            const doc = JSON.parse(strDoc);
            let dwgDoc = new vjmap.DbDocument();
            dwgDoc.entitys = doc.entitys;
            let geojson = await map.createDbGeomData(dwgDoc, true, true, {renderAccuracy: 0.005});
            map.getDrawLayer().set(geojson);
            map.fitMapBounds()
        }

		// Write the example code below this
		var line = {
          type: 'line',
          origin: [0, 0],
          end: [50, 50]
         };
        let dwgDoc = vjgeo.exporter.toDWG(line);

		// end
		setDwgDocData(dwgDoc);
		const mousePositionControl = new vjmap.MousePositionControl();
		map.addControl(mousePositionControl, "bottom-left");
	} catch (e) {
		console.error(e)
	}
})();
    </script>
</html>
2
3
4
5
6
7
8
9
10
11
12
13
14
15
16
17
18
19
20
21
22
23
24
25
26
27
28
29
30
31
32
33
34
35
36
37
38
39
40
41
42
43
44
45
46
47
48
49
50
51
52
53
54
55
56
57
58
59
60
61
62
63
64
65
66
67
68
You can also pass this path array as a parameter
var line = {
  type: 'line',
  origin: [0, 0],
  end: [50, 50]
 };
var circle = {
  type: 'circle',
  origin: [0, 0],
  radius: 50
 };
var pathArray = [ line, circle ];
let dwgDoc = vjgeo.exporter.toDWG(pathArray);
2
3
4
5
6
7
8
9
10
11
12
# Model
A model is the core object of vjgeo, with the following properties:
- origin: base point
- paths: model path objects
- models: child model objects
Example of passing paths as model parameters
var line = {
  type: 'line',
  origin: [0, 0],
  end: [50, 50]
 };
var circle = {
  type: 'circle',
  origin: [0, 0],
  radius: 50
 };
var pathObject = { myLine: line, myCircle: circle };
var model = { paths: pathObject };
let dwgDoc = vjgeo.exporter.toDWG(model);
2
3
4
5
6
7
8
9
10
11
12
13
If we wrap the model code in a function, we can call it multiple times. There are many ways to do this. First, we'll keep the code unchanged and return the model variable.
function myModel() {
 var line = {
   type: 'line',
   origin: [0, 0],
   end: [50, 50]
  };
 var circle = {
   type: 'circle',
   origin: [0, 0],
   radius: 50
  };
 var pathObject = { myLine: line, myCircle: circle };
 var model = { paths: pathObject };
 return model;
}
let dwgDoc = vjgeo.exporter.toDWG(myModel());
2
3
4
5
6
7
8
9
10
11
12
13
14
15
16
Or, we can change our function to use the new operator and set our model properties with the this keyword:
function myModel() {
 var line = {
   type: 'line',
   origin: [0, 0],
   end: [50, 50]
  };
 var circle = {
   type: 'circle',
   origin: [0, 0],
   radius: 50
  };
 var pathObject = { myLine: line, myCircle: circle };
 this.paths = pathObject;
}
let dwgDoc = vjgeo.exporter.toDWG(new myModel());
2
3
4
5
6
7
8
9
10
11
12
13
14
15
We will create a new model with 2 instances of myModel
function myModel() {
 var line = {
   type: 'line',
   origin: [0, 0],
   end: [50, 50]
  };
 var circle = {
   type: 'circle',
   origin: [0, 0],
   radius: 50
  };
 var pathObject = { myLine: line, myCircle: circle };
 this.paths = pathObject;
}
var model1 = new myModel();
var model2 = new myModel();
model2.origin = [100, 0];
var model = {
  models: { "myModel1": model1, "myModel2": model2 }
};
let dwgDoc = vjgeo.exporter.toDWG(model);
2
3
4
5
6
7
8
9
10
11
12
13
14
15
16
17
18
19
20
21
Set fill and color properties for models
Use the isFill property for fill; it only applies to path objects like circles, arcs, and closed paths. Use isHole for holes.
Color property can be applied to model or path objects
function myModel() {
			let points = [
                [100, 300], [100, 300], [100, 400], [0, 475], [-100, 400], [-100, 300],
                [-20, 300], [-20, 380], [20, 380], [20, 300], [20, 300]
            ];
            let polyline = new vjgeo.models.Polyline(true, points);
			polyline.data = {
                colorIndex: 2,
                isFill: true,
                alpha: 100
            }
			let hole = {
				paths: {
					circle: new vjgeo.paths.Circle([1000, 300], 300),
					rectLine1: new vjgeo.paths.Line([900, 200], [1100, 200]),
					rectLine2: new vjgeo.paths.Line([1100, 200], [1100, 400]),
					rectLine3: new vjgeo.paths.Line([1100, 400], [900, 400]),
					rectLine4: new vjgeo.paths.Line([900, 400], [900, 200])
				},
				data: {
					color: 0x00FFFF,
					isHole: true
				}
			}
			this.models = {polyline, hole}
}
var model1 = new myModel();
var model2 = new myModel();
model2.origin = [0, -800];
model2.models.polyline.data.colorIndex = 1; // change color
model2.models.polyline.data.alpha = 255; // opaque
var model = {
  models: { "myModel1": model1, "myModel2": model2 }
};
let dwgDoc = vjgeo.exporter.toDWG(model);
2
3
4
5
6
7
8
9
10
11
12
13
14
15
16
17
18
19
20
21
22
23
24
25
26
27
28
29
30
31
32
33
34
35
Can also be combined with vjmap DWG entity types for creation
function myModel() {
    let points = [
        [50, -500], [100, -500]
    ];
    let polyline = new vjgeo.models.Polyline(false, points);
    polyline.data = {
        colorIndex: 2
    }
    let dim = new vjgeo.models.DbEntity("DbAlignedDimension", [
        {
            point: [75, -520],
            attr: "dimLinePoint"
        },
        {
            point: [50, -500],
            attr: "xLine1Point"
        },
        {
            point: [100, -500],
            attr: "xLine2Point"
        }
    ], {
        dimScale: 10,
        textColor: 0x00FFFF,
        arrowColor: 0x00FF00,
        lineColor: 0xFF0000
    });
    this.models = {polyline, dim}
}
var model1 = new myModel();
var model2 = new myModel();
model2.origin = [0, -50];
vjgeo.model.scale(model2, 2, false, [50, -550]);
let text = new vjgeo.models.Text("hello vjmap", [100, -540], 10, Math.PI / 8);
text.data.colorIndex = 6;
var model = {
    models: {model1,model2,text}
};
let dwgDoc = vjgeo.exporter.toDWG(model);
2
3
4
5
6
7
8
9
10
11
12
13
14
15
16
17
18
19
20
21
22
23
24
25
26
27
28
29
30
31
32
33
34
35
36
37
38
39
# Built-in Models
Built-in models include
- Belt
- Bezier Curve
- Bolt Circle
- Bolt Rectangle
- Connect the dots
- DbEntity
- Dogbone
- Dome
- Ellipse
- Elliptic Arc
- Holes
- Oval
- OvalArc
- Polygon
- Rectangle
- Ring
- RoundRectangle
- S curve
- Slot
- Square
- Star
- Text
# Moving Models
Models and paths can be moved to absolute positions, or moved by [x, y] amounts relative to their current position. Remember that since paths are contained in models, and models may be contained in models, their coordinates are relative to the containing model.
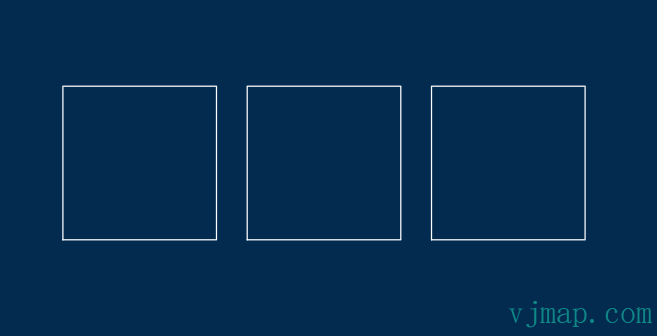
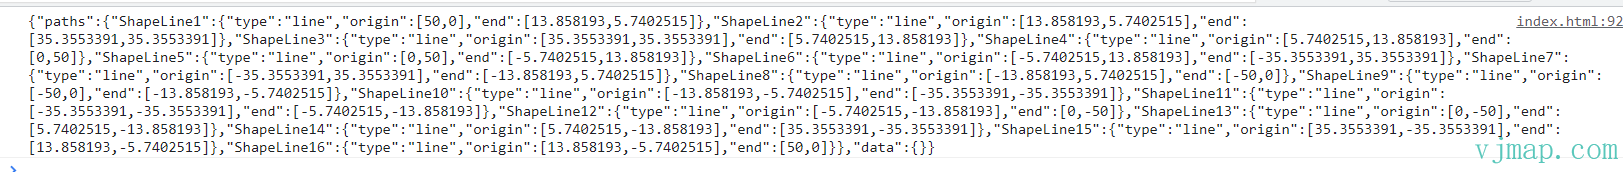
To illustrate this, let's create a model with several squares
function Squares() {
	this.models = {
		s1: new vjgeo.models.Square(100),
		s2: vjgeo.model.move(new vjgeo.models.Square(100), [120, 0]),
		s3: new vjgeo.models.Square(100)
	};
	//move the third square by setting its origin property.
	this.models.s3.origin = [240, 0];
}
var squares = new Squares();
let dwgDoc = vjgeo.exporter.toDWG(squares);
2
3
4
5
6
7
8
9
10
11
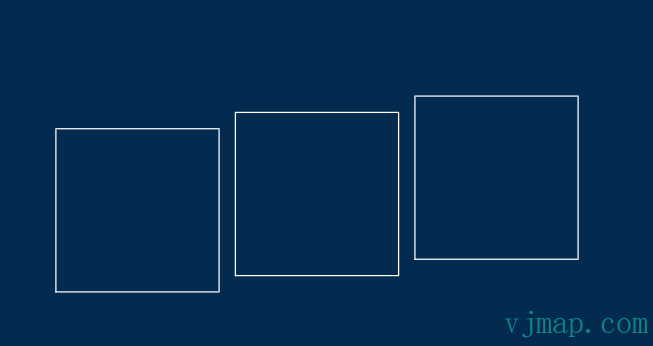
To move a model to an absolute position, set its origin property. The vjgeo.model.move function does this, and also allows you to perform more operations in one line of code.
To move a model by a relative amount, use vjgeo.model.moveRelative:
function Squares() {
    this.models = {
        s1: new vjgeo.models.Square(100),
        s2: vjgeo.model.move(new vjgeo.models.Square(100), [120, 0]),
        s3: new vjgeo.models.Square(100)
    };
    this.models.s3.origin = [240, 0];
}

var squares = new Squares();

//move some squares by a relative distance
vjgeo.model.moveRelative(squares.models.s2, [-10, 10]);
vjgeo.model.moveRelative(squares.models.s3, [-20, 20]);
let dwgDoc = vjgeo.exporter.toDWG(squares);
2
3
4
5
6
7
8
9
10
11
12
13
14
15
Similarly, use vjgeo.path.move to move a path absolutely or vjgeo.path.moveRelative to move it relatively:
function Squares() {
    this.models = {
        s1: new vjgeo.models.Square(100),
        s2: vjgeo.model.move(new vjgeo.models.Square(100), [120, 0]),
        s3: new vjgeo.models.Square(100)
    };
    this.models.s3.origin = [240, 0];
}

var squares = new Squares();

//move a path by a relative distance
vjgeo.path.moveRelative(squares.models.s3.paths.ShapeLine3, [0, 20]);

//move a path to an absolute point
vjgeo.path.move(squares.models.s2.paths.ShapeLine1, [30, 20]);
let dwgDoc = vjgeo.exporter.toDWG(squares);
2
3
4
5
6
7
8
9
10
11
12
13
14
15
16
17
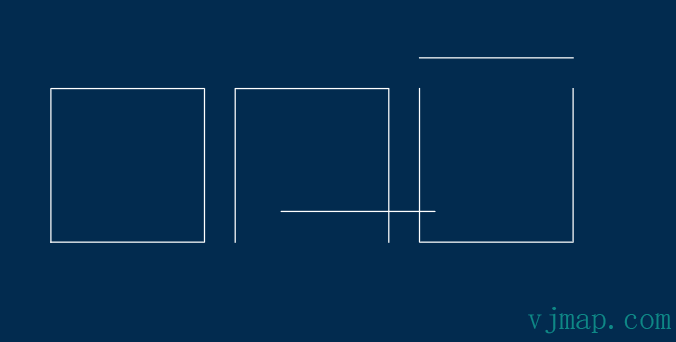
Note that the second square has origin [120, 0], but we moved a line inside the square to absolute point [30, 20]. Since the line is contained in the square model, its coordinates are relative to the square, which is why it appears at [150, 20].
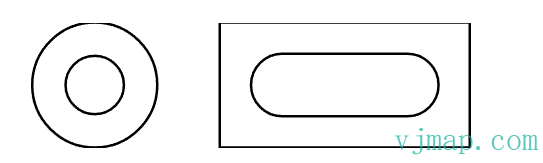
# Custom Models
Given the basic models and the ability to move their instances, we can now start modeling. Here are some examples of how to use them:
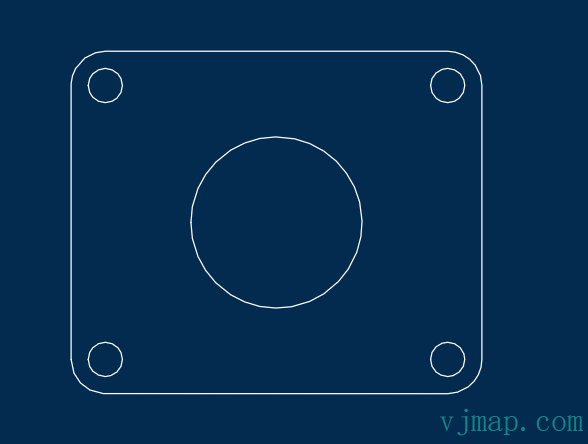
Tablet stand:
var outer = new vjgeo.models.RoundRectangle(200, 280, 8);
var inner = new vjgeo.models.RoundRectangle(160, 230, 8);
inner.origin = [20, 30];
var buttonhole = new vjgeo.paths.Circle([100, 15], 8);
var bolts = new vjgeo.models.BoltRectangle(180, 260, 2);
bolts.origin = [10, 10];
var tabletFaceMount = {
  paths: { buttonhole: buttonhole },
  models: { inner: inner, outer: outer, bolts: bolts }
};
let dwgDoc = vjgeo.exporter.toDWG(tabletFaceMount);
2
3
4
5
6
7
8
9
10
11
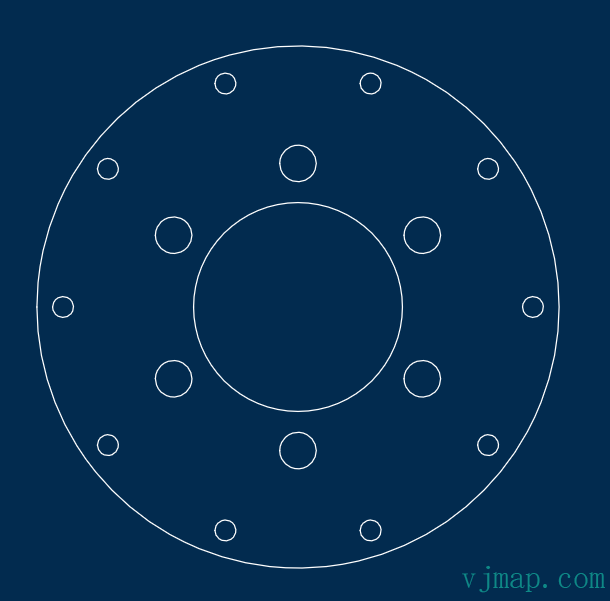
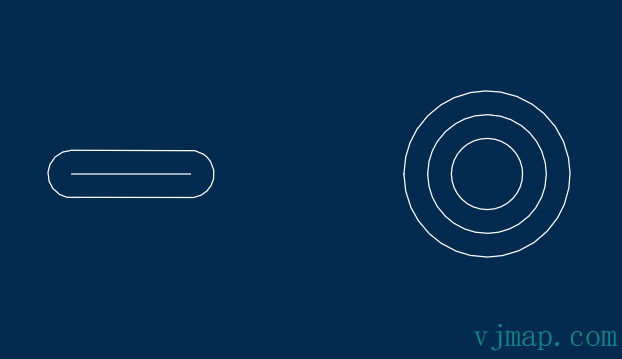
Circular adapter plate:
var model = {
  models: {
    ring1: new vjgeo.models.Ring(40, 100),
    bc1: new vjgeo.models.BoltCircle(90, 4, 10),
    bc2: new vjgeo.models.BoltCircle(55, 7, 6, 30)
  }
};
let dwgDoc = vjgeo.exporter.toDWG(model);
2
3
4
5
6
7
8
# Measurement
To get the bounding rectangle of a path or model, use:
- vjgeo.measure.pathExtents(path: object)
- vjgeo.model.modelExtents(model: object)
Path measurement example:
var arc = new vjgeo.paths.Arc([0, 0], 100, 45, 135);
var m = vjgeo.measure.pathExtents(arc);

console.log('measurement:');
console.log(m);

var totalWidth = m.high[0] - m.low[0];
var totalHeight = m.high[1] - m.low[1];

var measureRect = new vjgeo.models.Rectangle(totalWidth, totalHeight);
measureRect.origin = m.low;

var model = {
    paths: {
        arc: arc
    },
    models: {
        measureRect: measureRect
    }
};

let dwgDoc = vjgeo.exporter.toDWG(model);
2
3
4
5
6
7
8
9
10
11
12
13
14
15
16
17
18
19
20
21
22
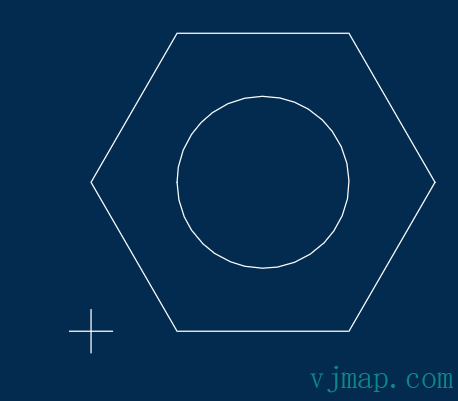
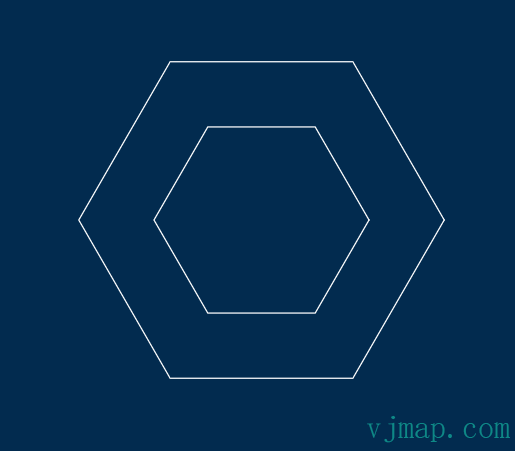
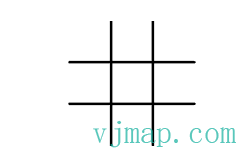
# Zero and Center
To move a model so its bottom and left edges lie on the x and y axes, use model.zero. This function accepts 2 boolean parameters: zeroOnXAxis, zeroOnYAxis. If no parameters are passed, it will zero on both axes.
var model = {
  models: {
    crosshairs: {
      paths: {
        h: new vjgeo.paths.Line([-5, 0], [5, 0]),
        v: new vjgeo.paths.Line([0, -5], [0, 5])
      }
    },
    nut: {
      models: {
        polygon: new vjgeo.models.Polygon(6, 40)
      },
      paths: {
        inner: new vjgeo.paths.Circle(20)
      }
    }
  }
};
vjgeo.model.zero(model.models.nut);
let dwgDoc = vjgeo.exporter.toDWG(model);
2
3
4
5
6
7
8
9
10
11
12
13
14
15
16
17
18
19
20
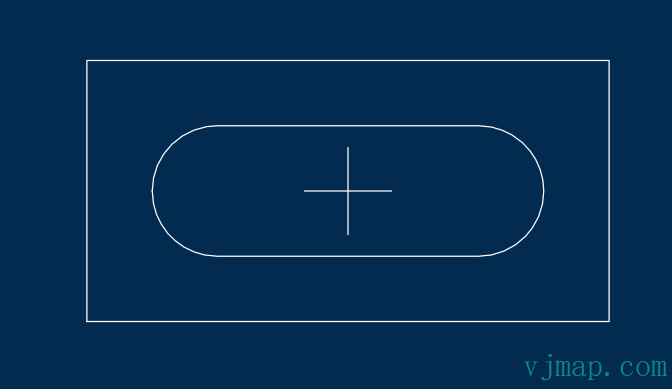
To move a model so it is centered on the x and y axes, use model.center. This function accepts 2 boolean parameters: centerOnXAxis, centerOnYAxis. If no parameters are passed, it will center on both axes.
var model = {
  models: {
    crosshairs: {
      paths: {
        h: new vjgeo.paths.Line([-5, 0], [5, 0]),
        v: new vjgeo.paths.Line([0, -5], [0, 5])
      }
    },

    box: {
      models: {
        outer: new vjgeo.models.Rectangle(60, 30),
        inner: new vjgeo.models.Oval(45, 15)
      }
    }
  }
};
var shortcut = model.models.box.models;
vjgeo.model.center(shortcut.outer);
vjgeo.model.center(shortcut.inner);
let dwgDoc = vjgeo.exporter.toDWG(model);
2
3
4
5
6
7
8
9
10
11
12
13
14
15
16
17
18
19
20
21
# Unified Coordinate System
Paths in a model are referenced relative to their parent model. Sometimes you may want all objects in the same coordinate space. Let's create a simple demo model:
function box(origin) {
    this.models = {
        outer: new vjgeo.models.RoundRectangle(100, 100, 1)
    };
    this.paths = {
      inner: new vjgeo.paths.Circle([50, 50], 25)
    };
    this.origin = origin;
}

var box1 = new box([0, 0]);
var box2 = new box([150, 0]);

var model = {
    models: {
        box1: box1,
        box2: box2
    }
};
let dwgDoc = vjgeo.exporter.toDWG(model);
2
3
4
5
6
7
8
9
10
11
12
13
14
15
16
17
18
19
20
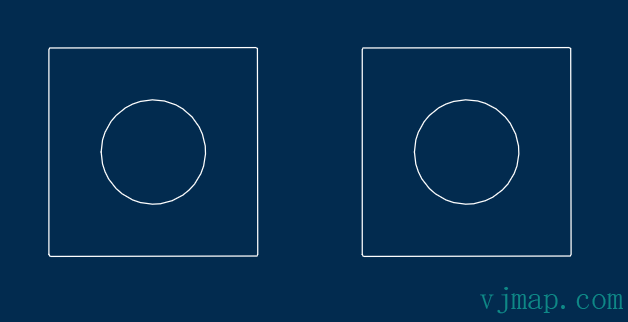
In this example, although box1.paths.inner.origin and box2.paths.inner.origin are not in the same position, they both have origin [50, 50] because they are positioned relative to the model containing them. To make all models and paths occupy a single coordinate space, we can use vjgeo.model.originate:
function box(origin) {
    this.models = {
        outer: new vjgeo.models.RoundRectangle(100, 100, 1)
    };
    this.paths = {
      inner: new vjgeo.paths.Circle([50, 50], 25)
    };

    this.origin = origin;
}

var box1 = new box([0, 0]);
var box2 = new box([150, 0]);

var model = {
    models: {
        box1: box1,
        box2: box2
    }
};

//move all path origins into the same space
vjgeo.model.originate(model);
let dwgDoc = vjgeo.exporter.toDWG(model);
2
3
4
5
6
7
8
9
10
11
12
13
14
15
16
17
18
19
20
21
22
23
24
# Scaling
To scale a simple point proportionally, use vjgeo.point.scale.
Path scaling example:
var model = {
  models: {
    inner: new vjgeo.models.Polygon(6, 40),
    outer: vjgeo.model.scale(new vjgeo.models.Polygon(6, 40), 1.7)
  }
};
let dwgDoc = vjgeo.exporter.toDWG(model);
2
3
4
5
6
7
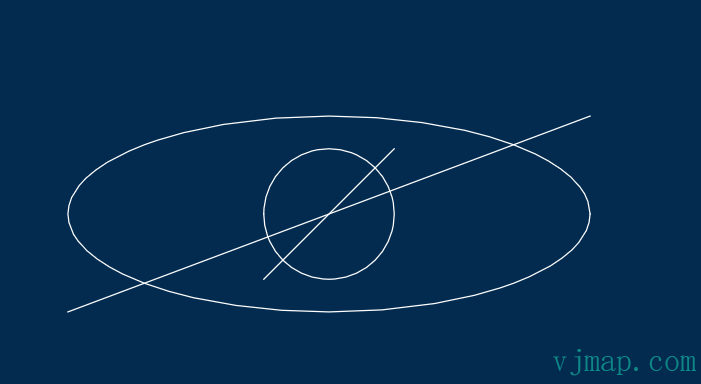
# Distortion
To scale a simple point non-proportionally, use vjgeo.point.distort.
To scale a path non-proportionally, use vjgeo.path.distort (path: object, scaleX: number, scaleY: number). Returns a new object without modifying the original. The type of the returned object depends on the distorted path type:
- A line returns an IPath line object, since distortion can be represented by another line.
- An arc returns a BezierCurve IModel object, since the distortion is not circular.
- A circle returns an Ellipse IModel object, since the distortion is not circular.
var circle = new vjgeo.paths.Circle(50);
var line = new vjgeo.paths.Line([-50,-50], [50, 50]);

var distortedLine = vjgeo.path.distort(line, 4, 1.5);

var ellipse = vjgeo.path.distort(circle, 4, 1.5);

var model = {
  paths: {
    circle: circle,
    line: line,
    distortedLine: distortedLine
  },
  models: {
    ellipse: ellipse
  }
};
let dwgDoc = vjgeo.exporter.toDWG(model);
2
3
4
5
6
7
8
9
10
11
12
13
14
15
16
17
18
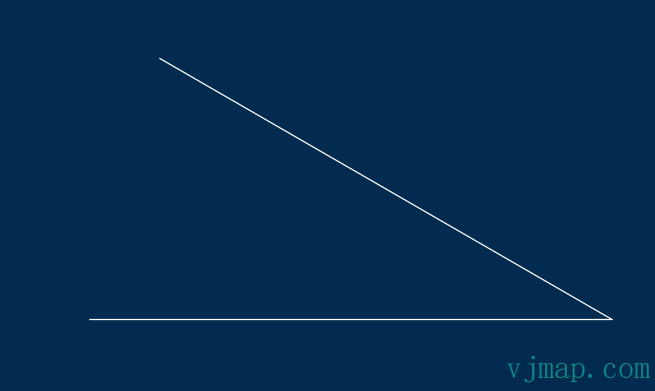
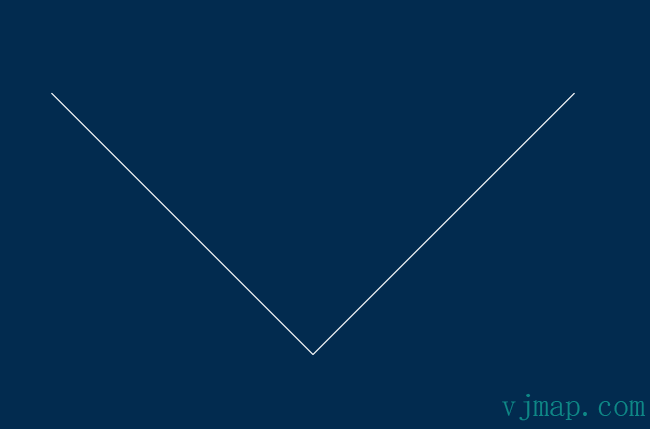
# Rotation
var line1 = new vjgeo.paths.Line([0, 0], [100, 0]);
var line2 = new vjgeo.paths.Line([0, 0], [100, 0]);

var paths = [line1, vjgeo.path.rotate(line2, -30, [100, 0])];
let dwgDoc = vjgeo.exporter.toDWG(paths);
2
3
4
5
# Cloning
Models and paths are simple JavaScript objects, so they are easy to clone in the standard JavaScript way. vjgeo provides several cloning functions:
- vjgeo.cloneObject - Clone a model or any other object.
- vjgeo.path.clone - Clone a path (faster than cloneObject)
- vjgeo.point.clone - Clone a point (faster than cloneObject) Cloning is useful in many cases. For example, if you need multiple copies of a model for rotation:
function sawtooth(numTeeth, r1, rd, offset) {
    var a = 360 / numTeeth;
    var a1 = 90 - a / 2;
    var r2 = r1 + rd;
    var p1 = vjgeo.point.fromPolar(vjgeo.angle.toRadians(a1), r1);
    var p2 = vjgeo.point.rotate(p1, a, [0, 0]);
    var p3 = [-offset, r2];
    this.paths = {
        outer: new vjgeo.paths.Arc(p1, p3, r2 / 4, false, false),
        inner: new vjgeo.paths.Arc(p2, p3, r1 / 4, false, false)
    };
}
var wheel = { models: {} };
var numTeeth = 30;
var tooth = new sawtooth(numTeeth, 100, 20, 10);
for (var i = 0; i < numTeeth; i++ ) {
    var clone = vjgeo.cloneObject(tooth);
    var a = 360 / numTeeth;
    vjgeo.model.rotate(clone, a * i, [0, 0]);
    wheel.models[i] = clone;
}
let dwgDoc = vjgeo.exporter.toDWG(wheel);
2
3
4
5
6
7
8
9
10
11
12
13
14
15
16
17
18
19
20
21
22
# Mirror
Use vjgeo.angle.mirror for angle mirroring, vjgeo.point.mirror for single-point mirroring.
You can create mirrored copies of paths and models with these functions. Mirroring can occur on the x-axis, y-axis, or both.
- vjgeo.path.mirror (path: object, mirrorX: boolean, mirrorY: boolean)
- vjgeo.model.mirror (model: object, mirrorX: boolean, mirrorY: boolean) Each of these functions returns a new object and does not modify the original.
Path mirroring example:
var line1 = new vjgeo.paths.Line([0, 0], [100, 100]);
var line2 = vjgeo.path.mirror(line1, true, false);
var paths = [line1, line2];
let dwgDoc = vjgeo.exporter.toDWG(paths);
2
3
4
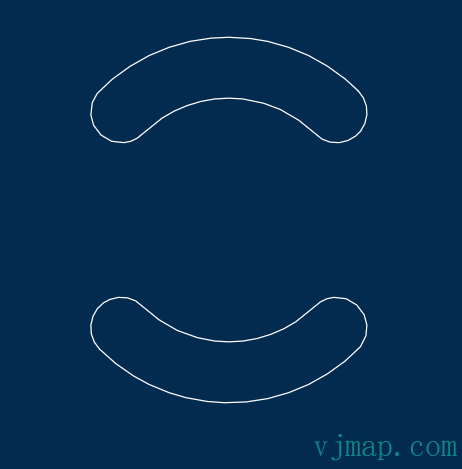
Model mirroring example:
var ovalArc1 = new vjgeo.models.OvalArc(45, 135, 50, 10);
var model = {
    models: {
        ovalArc1: ovalArc1,
        ovalArc2: vjgeo.model.mirror(ovalArc1, false, true)
    }
};
let dwgDoc = vjgeo.exporter.toDWG(model);
2
3
4
5
6
7
8
# Repeat Layout
vjgeo provides several functions to clone your paths or models and repeat them in various layouts.
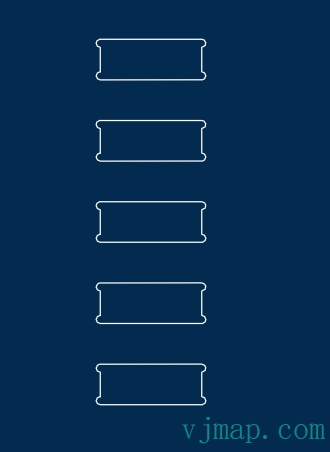
# Column
Call vjgeo.layout.cloneToColumn(path or model, count, [optional] margin) to repeat clones in a column. Spacing will be the height of the path or model bounding box. Extra vertical margin is optional.
var dogbone = new vjgeo.models.Dogbone(50, 20, 2, -1, false);
var grooves = vjgeo.layout.cloneToColumn(dogbone, 5, 20);
let dwgDoc = vjgeo.exporter.toDWG(grooves);
2
3
# Row
Call vjgeo.layout.cloneToRow(path or model, count, [optional] margin) to repeat clones in a row. Spacing will be the width of the path or model bounding box. Extra horizontal margin is optional.
var oval = new vjgeo.models.Oval(20, 150);
var grill = vjgeo.layout.cloneToRow(oval, 12, 20);
let dwgDoc = vjgeo.exporter.toDWG(grill);
2
3

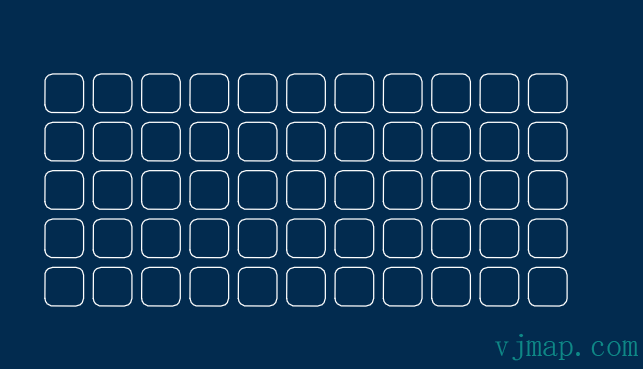
# Grid
var roundSquare = new vjgeo.models.RoundRectangle(20, 20, 4);
var grid = vjgeo.layout.cloneToGrid(roundSquare, 11, 5, 5);
let dwgDoc = vjgeo.exporter.toDWG(grid);
2
3
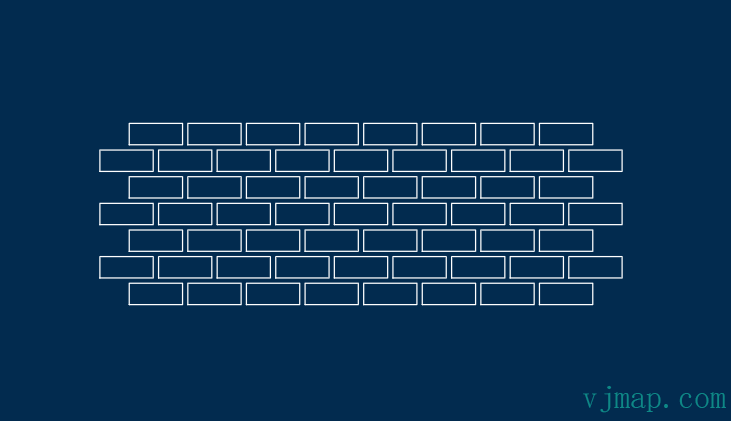
# Brick
var brick = new vjgeo.models.Rectangle(20, 8);
var wall = vjgeo.layout.cloneToBrick(brick, 8, 7, 2);
let dwgDoc = vjgeo.exporter.toDWG(wall);
2
3
# Honeycomb
var star = vjgeo.model.rotate(new vjgeo.models.Star(6, 50, 0, 2), 30);
var pattern = vjgeo.layout.cloneToHoneycomb(star, 8, 5, 30);
let dwgDoc = vjgeo.exporter.toDWG(pattern);
2
3
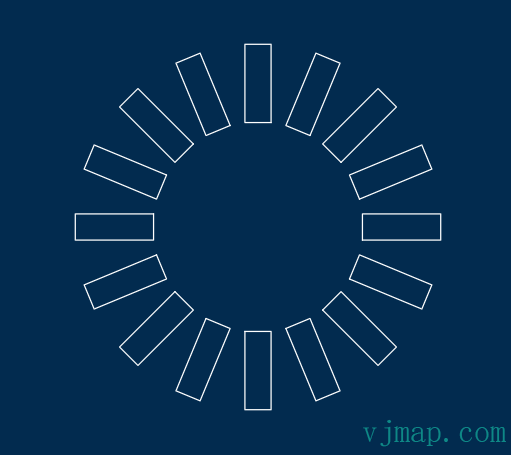
# Radial
var rect = vjgeo.model.move(new vjgeo.models.Rectangle(30, 10), [40, -5]);
var spinner = vjgeo.layout.cloneToRadial(rect, 16, 22.5);
let dwgDoc = vjgeo.exporter.toDWG(spinner);
2
3
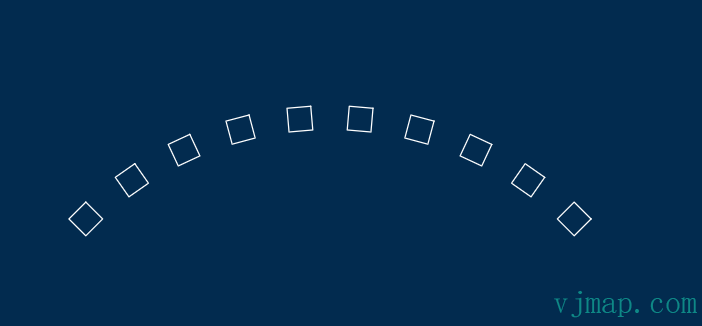
# Path Layout
var square = new vjgeo.models.Square(10);
var row = vjgeo.layout.cloneToRow(square, 10, 10);
var arc = new vjgeo.paths.Arc([0, 0], 150, 45, 135);
vjgeo.layout.childrenOnPath(row, arc);
let dwgDoc = vjgeo.exporter.toDWG(row);
2
3
4
5
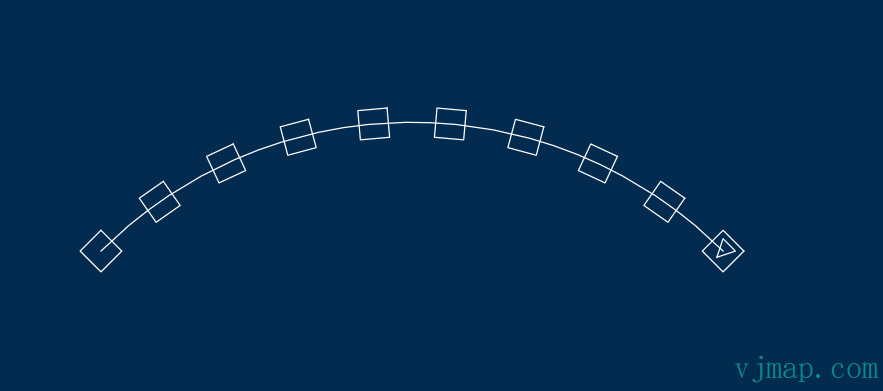
var square = new vjgeo.models.Square(10);
var row = vjgeo.layout.cloneToRow(square, 10, 10);
row.models[0].models = { triangle: new vjgeo.models.Polyline(true, [ [5, 8], [2, 2], [8, 2] ]) };
var arc = new vjgeo.paths.Arc([0, 0], 150, 45, 135);
//layout on the y-center
vjgeo.layout.childrenOnPath(row, arc, 0.5);
row.paths = { arc: arc };
let dwgDoc = vjgeo.exporter.toDWG(row);
2
3
4
5
6
7
8
If you want each child placed on the path but not rotated, set rotate to false
var square = new vjgeo.models.Square(10);
var row = vjgeo.layout.cloneToRow(square, 10, 10);
row.models[0].models = { triangle: new vjgeo.models.Polyline(true, [ [5, 8], [2, 2], [8, 2] ]) };
var arc = new vjgeo.paths.Arc([0, 0], 150, 45, 135);
//layout on the y-center, reversed, not contained, not rotated
vjgeo.layout.childrenOnPath(row, arc, 0.5, true, false, false);
arc.layer = "red";
row.paths = { arc: arc };
let dwgDoc = vjgeo.exporter.toDWG(row);
2
3
4
5
6
7
8
9
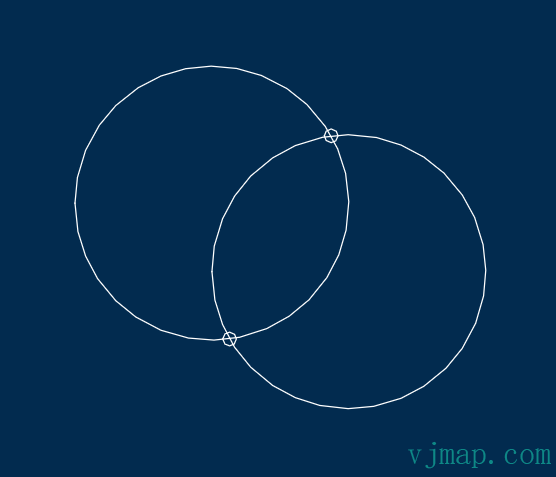
# Intersection Points
You can use vjgeo.path.intersection to find the intersection points between two paths. If the paths do not intersect, this function returns null. Otherwise, it returns an object with a property named intersectionPoints, which is an array of points. Additionally, if either path is an arc or circle, this object will contain the angles at which the intersections occur.
Intersection point example:
var model = {
    paths: {
        line1: new vjgeo.paths.Line([0, 0], [20, 10]),
        line2: new vjgeo.paths.Line([2, 10], [50, 2])
    }
};
var int = vjgeo.path.intersection(model.paths.line1, model.paths.line2);
if (int) {
    var p = int.intersectionPoints[0];
    var id = JSON.stringify(vjgeo.point.rounded(p, 0.01));
    model.paths[id] = new vjgeo.paths.Circle(p, 1);
}
let dwgDoc = vjgeo.exporter.toDWG(model);
2
3
4
5
6
7
8
9
10
11
12
13
var model = {
    paths: {
        circle1: new vjgeo.paths.Circle([0, 10], 20),
        circle2: new vjgeo.paths.Circle([20, 0], 20)
    }
};
var int = vjgeo.path.intersection(model.paths.circle1, model.paths.circle2);
if (int) {
    int.intersectionPoints.forEach(
        function(p, i) {
            var id = JSON.stringify(vjgeo.point.rounded(p, 0.01)) + ' intersects circle1 at ' + vjgeo.round(int.path1Angles[i], .01) + ' circle2 at ' + vjgeo.round(int.path2Angles[i], .01);
            model.paths[id] = new vjgeo.paths.Circle(p, 1);
        }
    );
}
let dwgDoc = vjgeo.exporter.toDWG(model);
2
3
4
5
6
7
8
9
10
11
12
13
14
15
16
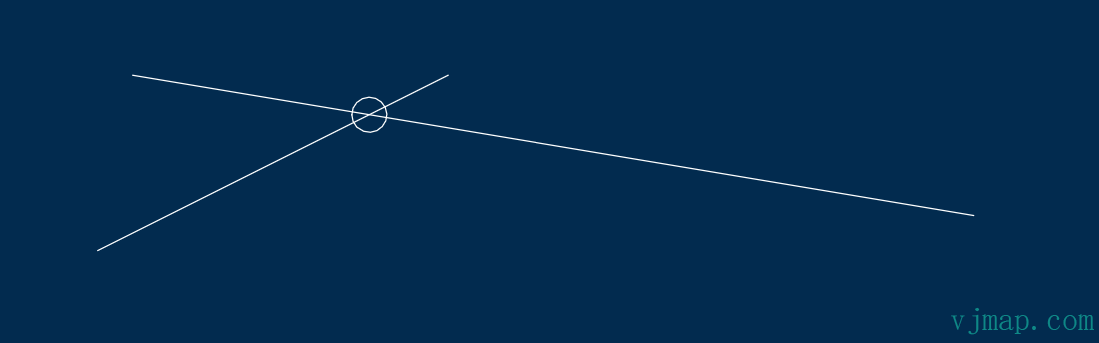
# Intersecting Lines
To make lines meet at their intersection point, use vjgeo.path.converge. This only works for straight lines, not arcs.
The converge function will try to use the line end closest to the convergence point. If you need to specify which end of the line to converge, pass two additional boolean values. true means use the line's start point, false means use the line's end point.
var model = {
  origin: [0, 0],
  paths: {
    line1: new vjgeo.paths.Line([0, 0], [10, 5]),
    line2: new vjgeo.paths.Line([0, 10], [10, 4]),
    line3: new vjgeo.paths.Line([1, 0], [5, -2])
  }
};
var clone1 = vjgeo.cloneObject(model);
clone1.origin = [10, 0];
var clone2 = vjgeo.cloneObject(model);
clone2.origin = [20, 0];
vjgeo.path.converge(clone1.paths.line1, clone1.paths.line2);
vjgeo.path.converge(clone1.paths.line1, clone1.paths.line3);
vjgeo.path.converge(clone2.paths.line1, clone2.paths.line2, false, true);
vjgeo.path.converge(clone2.paths.line1, clone2.paths.line3, true, false);
let dwgDoc = vjgeo.exporter.toDWG({ models: { before: clone1, after: model, x: clone2 } });
2
3
4
5
6
7
8
9
10
11
12
13
14
15
16
17
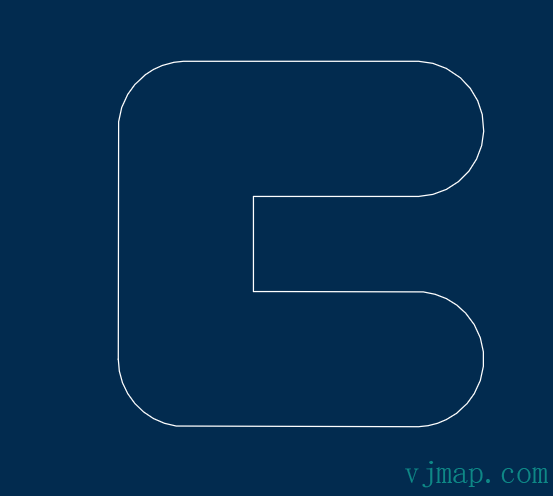
# Modifying Models
We know models are relatively simple objects with a well-known recursive structure. This allows us to modify them for different purposes. Let's modify and combine two different models in one drawing.
For this example, we will use ovals to make an oval-shaped L. We first create a model function with two ovals.
By debugging the model tree, we know that Oval is RoundRectangle and the arc ids are BottomLeft, BottomRight, TopLeft, and TopRight. The edge ids are Left, Right, Top, and Bottom. We also need to pay attention to the direction of these lines to know which are start and end points.
To delete a path, we use the JavaScript delete keyword
function ovalL(width, height, thickness) {
    var ovalH = new vjgeo.models.Oval(width, thickness);
    var ovalV = new vjgeo.models.Oval(thickness, height);
    delete ovalV.paths.BottomLeft;
    delete ovalV.paths.BottomRight;
    delete ovalH.paths.TopLeft;
    ovalH.paths.Top.end =
        ovalV.paths.Right.origin =
            [thickness, thickness];
    this.models = { h: ovalH, v: ovalV };
}

function ovalC(width, height, thickness) {
    var m =
        this.models =
            new ovalL(width, height, thickness).models;
    m.h2 = new vjgeo.models.Oval(width, thickness);
    m.h2.origin = [0, height - thickness];
    delete m.h2.paths.TopLeft;
    delete m.h2.paths.BottomLeft;
    delete m.v.paths.TopRight;

    //h2 has paths relative to h2 origin,
    //we need to originate to share the point
    vjgeo.model.originate(this);

    //share the point
    m.h2.paths.Bottom.origin =
        m.v.paths.Right.end =
            [thickness, height - thickness];
}

let dwgDoc = vjgeo.exporter.toDWG(new ovalC(100, 100, 37));
2
3
4
5
6
7
8
9
10
11
12
13
14
15
16
17
18
19
20
21
22
23
24
25
26
27
28
29
30
31
32
33
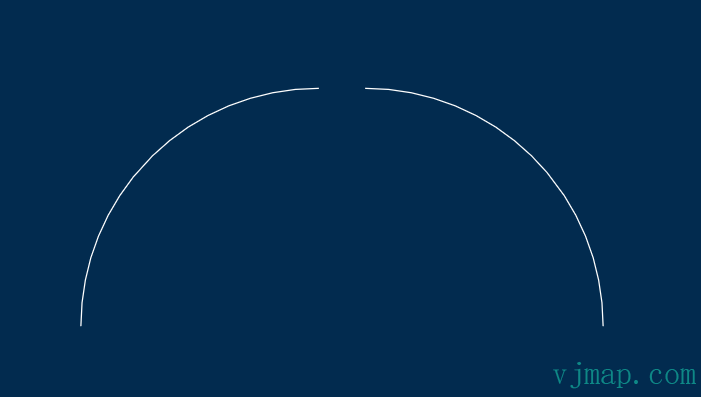
# Break
If there is a point on a path (e.g., from an intersection), you can use vjgeo.path.breakAtPoint to split the path into two parts. This function modifies the path you pass to it, breaking it at that point, and returns a new path object that is the other broken part.
var model = {
  paths: {
    arc: new vjgeo.paths.Arc([0, 0], 50, 0, 180)
  }
};

var arc2 = vjgeo.path.breakAtPoint(model.paths.arc, [0, 50]);
vjgeo.model.moveRelative(arc2, [-10, 0]);

model.paths.arc2 = arc2;
let dwgDoc = vjgeo.exporter.toDWG(model);
2
3
4
5
6
7
8
9
10
11
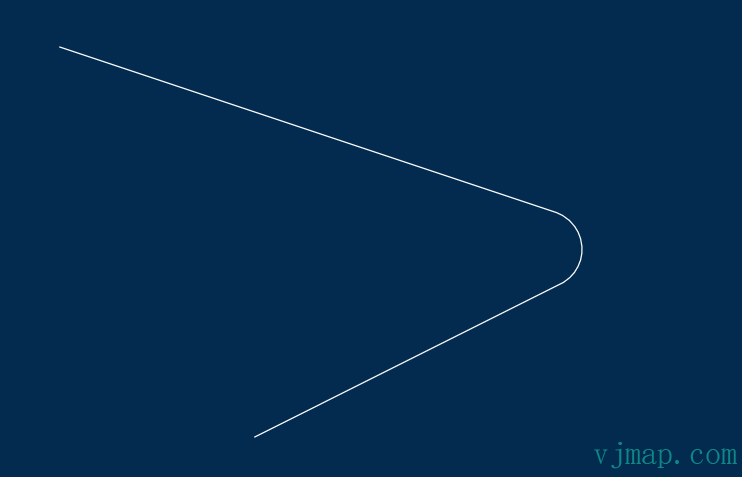
# Fillet
A fillet is a rounded corner where two paths meet. vjgeo provides two types of fillets: traditional fillet and dogbone fillet
# Traditional Fillet
var model = {
  paths: {
    line1: new vjgeo.paths.Line([0, 20], [30, 10]),
    line2: new vjgeo.paths.Line([10, 0], [30, 10])
  }
};

//create a fillet
var arc = vjgeo.path.fillet(model.paths.line1, model.paths.line2, 2);

//add the fillet to the model
model.paths.arc = arc;

let dwgDoc = vjgeo.exporter.toDWG(model);
2
3
4
5
6
7
8
9
10
11
12
13
14
# Dogbone Fillet
var dogbones = {
  models: {
    round: new vjgeo.models.Dogbone(100,50, 5, 0),
    horizontal: new vjgeo.models.Dogbone(100,50, 5, -1),
    vertical: new vjgeo.models.Dogbone(100,50, 5, 1)
  }
};

dogbones.models.horizontal.origin = [115, 0];
dogbones.models.vertical.origin = [230, 0];

let dwgDoc = vjgeo.exporter.toDWG(dogbones);
2
3
4
5
6
7
8
9
10
11
12
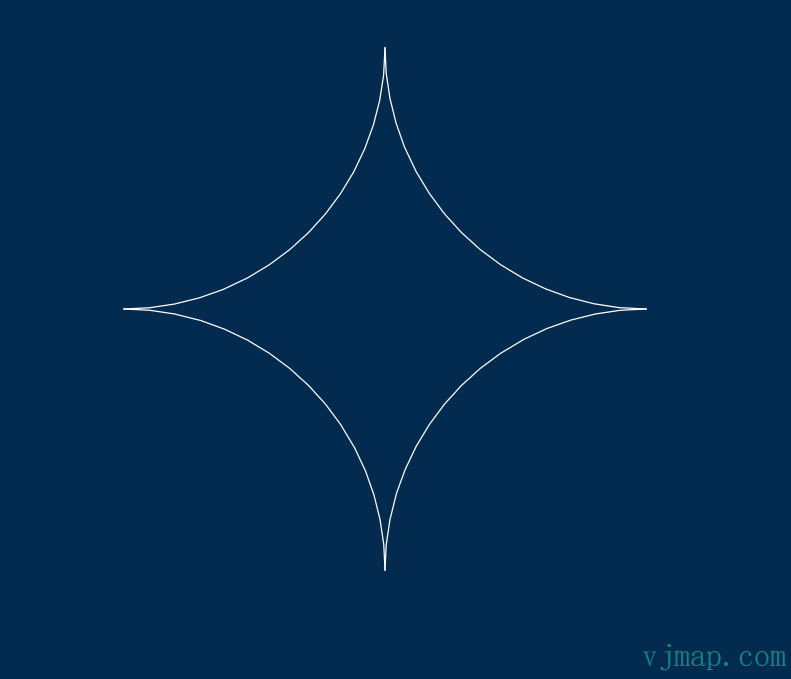
# Cascading Functions
vjgeo provides an easy way to cascade object-oriented style modifications to drawings, similar to the jQuery library.
Call vjgeo.$(x) to get the returned cascading container object. You can then call a series of cascading functions on x. Each function's output becomes the next function's input. The cascading container only works with functions whose output is the same type as the object passed as the first parameter, which must be one of:
- Model
- Path
- Point
The cascading container has special properties for operating on the container itself (as opposed to operating on x). These are prefixed with $:
- $initial : object - Get the original x object you passed in.
- $result : object - Get the final result of all cascading function calls.
- $reset() : function() - Reset the container to $initial.
var starburst = {};

vjgeo.$(new vjgeo.paths.Arc([5, 5], 5, 180, 270))
.addTo(starburst, 'arc1')
.mirror(true, false)
.addTo(starburst, 'arc2')
.mirror(false, true)
.addTo(starburst, 'arc3')
.mirror(true, false)
.addTo(starburst, 'arc4');

let dwgDoc = vjgeo.exporter.toDWG(starburst);
2
3
4
5
6
7
8
9
10
11
12
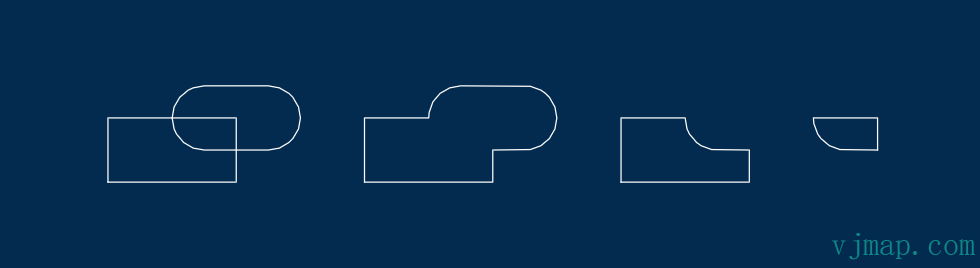
# Boolean Operations
You can use the vjgeo.model.combine function to combine models, passing these parameters:
- The first model to combine, we call it "modelA"
- The second model to combine, we call it "modelB"
- Boolean to include paths of model A that are inside model B
- Boolean to include paths of model A that are outside model B
- Boolean to include paths of model B that are inside model A
- Boolean to include paths of model B that are outside model A
- Each model must be a closed geometry and should not self-intersect. These examples show the effect of the 4 boolean parameters
function example(origin) {
    this.models = {
        rect: new vjgeo.models.Rectangle(100, 50),
        oval: vjgeo.model.move(new vjgeo.models.Oval(100, 50), [50, 25])
    };
    this.origin = origin;
}

var examples = {
    models: {
        x1: new example([0, 0]),
        x2: new example([200, 0]),
        x3: new example([400, 0]),
        x4: new example([500, 0])
    }
};

//save us some typing :)
var x = examples.models;

vjgeo.model.combine(x.x2.models.rect, x.x2.models.oval, false, true, false, true);
vjgeo.model.combine(x.x3.models.rect, x.x3.models.oval, false, true, true, false);
vjgeo.model.combine(x.x4.models.rect, x.x4.models.oval, true, false, true, false);
let dwgDoc = vjgeo.exporter.toDWG(examples);
2
3
4
5
6
7
8
9
10
11
12
13
14
15
16
17
18
19
20
21
22
23
24
Boolean flag shortcut: vjgeo.model.combineIntersection vjgeo.model.combineSubtraction vjgeo.model.combineUnion
function example(origin) {
    this.models = {
        rect: new vjgeo.models.Rectangle(100, 50),
        oval: vjgeo.model.move(new vjgeo.models.Oval(100, 50), [50, 25])
    };
    this.origin = origin;
}

var examples = {
    models: {
        x1: new example([0, 0]),
        x2: new example([200, 0]),
        x3: new example([400, 0]),
        x4: new example([500, 0])
    }
};

//save us some typing :)
var x = examples.models;

vjgeo.model.combineUnion(x.x2.models.rect, x.x2.models.oval);
vjgeo.model.combineSubtraction(x.x3.models.rect, x.x3.models.oval);
vjgeo.model.combineIntersection(x.x4.models.rect, x.x4.models.oval);
let dwgDoc = vjgeo.exporter.toDWG(examples);
2
3
4
5
6
7
8
9
10
11
12
13
14
15
16
17
18
19
20
21
22
23
24
# Boolean Operation Order
Combining models with boolean operations is a powerful feature, but can be challenging in some cases. You may need to remodel your drawing to achieve certain results. We will explore the concept of operation order through an example project.
var star = new vjgeo.models.Star(28, 25, 20);
var plus = vjgeo.model.rotate({
    models: {
        v: vjgeo.model.center(new vjgeo.models.Rectangle(3, 90)),
        h: vjgeo.model.center(new vjgeo.models.Rectangle(110, 3))
    }
}, -12.5);
vjgeo.model.combineUnion(plus.models.v, plus.models.h);
vjgeo.model.combineUnion(star, plus);
var starplus = {
    models: {
        star: star,
        plus: plus
    }
};
var frame = {
    models: {
        outer: vjgeo.model.center(new vjgeo.models.RoundRectangle(100, 80, 4)),
        inner: vjgeo.model.center(new vjgeo.models.Rectangle(90, 70))
    }
};
vjgeo.model.combineSubtraction(frame.models.inner, starplus); //subtract from the inner frame only
var model = {
    models: {
        starplus: starplus,
        frame: frame
    }
};
let dwgDoc = vjgeo.exporter.toDWG(model);
2
3
4
5
6
7
8
9
10
11
12
13
14
15
16
17
18
19
20
21
22
23
24
25
26
27
28
29
# Path Expansion
Paths can be expanded to generate closed geometric models that perfectly enclose them.
var model = {
  paths: {
    p1: new vjgeo.paths.Line([0, 2], [10, 2]),
    p2: new vjgeo.paths.Circle([35, 2], 5)
  }
};

model.models = {
    x1: vjgeo.path.expand(model.paths.p1, 2),
    x2: vjgeo.path.expand(model.paths.p2, 2)
};

let dwgDoc = vjgeo.exporter.toDWG(model);
2
3
4
5
6
7
8
9
10
11
12
13
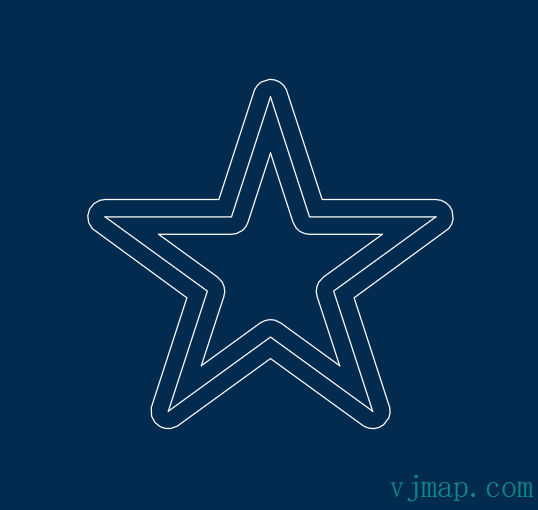
# Expand all paths in a model:
var star = vjgeo.model.rotate(new vjgeo.models.Star(5, 100), 18);
var expanded = vjgeo.model.expandPaths(star, 10);

var model = {
    models: {
        star: star,
        outline: expanded
    }
};

let dwgDoc = vjgeo.exporter.toDWG(model);
2
3
4
5
6
7
8
9
10
11
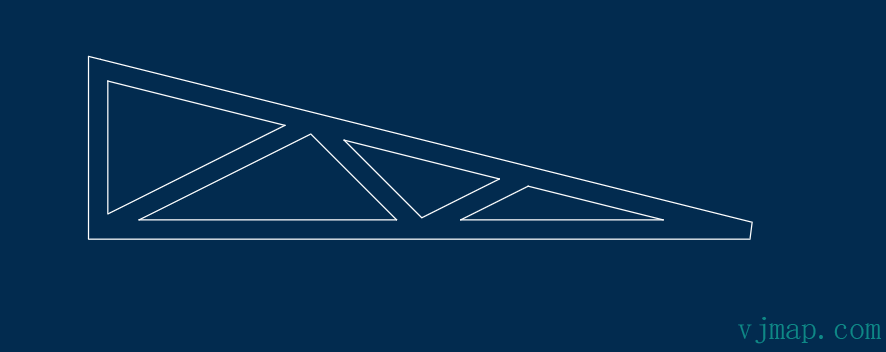
this.models = {
  frame: new vjgeo.models.Polyline(true, [ [0, h], [w, 0], [0, 0] ])
};

var angled = this.models.frame.paths.ShapeLine1;

var bracepoints = [
  [0, 0],
  vjgeo.point.middle(angled, 1/3),
  [w/2 , 0],
  vjgeo.point.middle(angled, 2/3)
];

this.models.brace = new vjgeo.models.Polyline(false, bracepoints);
}

var truss = new trussWireframe(200, 50);
var expansion = vjgeo.model.expandPaths(truss, 3, 1);

let dwgDoc = vjgeo.exporter.toDWG(expansion);
2
3
4
5
6
7
8
9
10
11
12
13
14
15
16
17
18
19
20
21
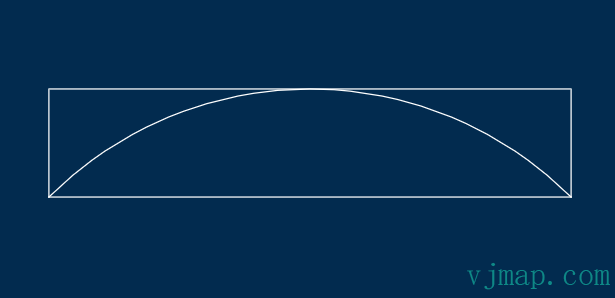
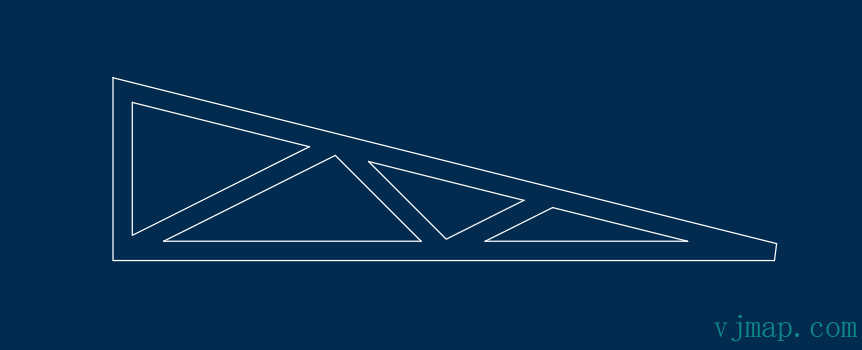
# Path Simplification
You can use vjgeo.model.simplify to simplify paths - but note: Your model must be created before calling the simplify function. This ensures all segmented paths share the same coordinate space.
function trussWireframe(w, h) {

this.models = {
  frame: new vjgeo.models.Polyline(true, [ [0, h], [w, 0], [0, 0] ])
};

var angled = this.models.frame.paths.ShapeLine1;

var bracepoints = [
  [0, 0],
  vjgeo.point.middle(angled, 1/3),
  [w/2 , 0],
  vjgeo.point.middle(angled, 2/3)
];

this.models.brace = new vjgeo.models.Polyline(false, bracepoints);
}

var truss = new trussWireframe(200, 50);
var expansion = vjgeo.model.expandPaths(truss, 3, 1);

//call originate before calling simplify:
vjgeo.model.originate(expansion);
vjgeo.model.simplify(expansion);

let dwgDoc = vjgeo.exporter.toDWG(expansion);
2
3
4
5
6
7
8
9
10
11
12
13
14
15
16
17
18
19
20
21
22
23
24
25
26
# Bezier Curve
	var points = [[0, 0], [50, 50], [50, -50], [100, 0]];

var curve1 = new vjgeo.models.BezierCurve(points);
curve1.origin = [0, 20];

//more accurate
var curve2 = new vjgeo.models.BezierCurve(points, 0.1);

var model = {
  models: {
    c1: curve1, c2: curve2
  }
};

let dwgDoc = vjgeo.exporter.toDWG(model);
2
3
4
5
6
7
8
9
10
11
12
13
14
15
# Import SVG
var pathData = "M942.08 696.32H81.92V81.92h860.16zM122.88 655.36h778.24V122.88H122.88z M491.52 675.84h40.96v163.84h-40.96zM204.8 860.16h614.4v40.96H204.8z"
var model = vjgeo.importer.fromSVGPathData(pathData);
let dwgDoc = vjgeo.exporter.toDWG(model);
2
3

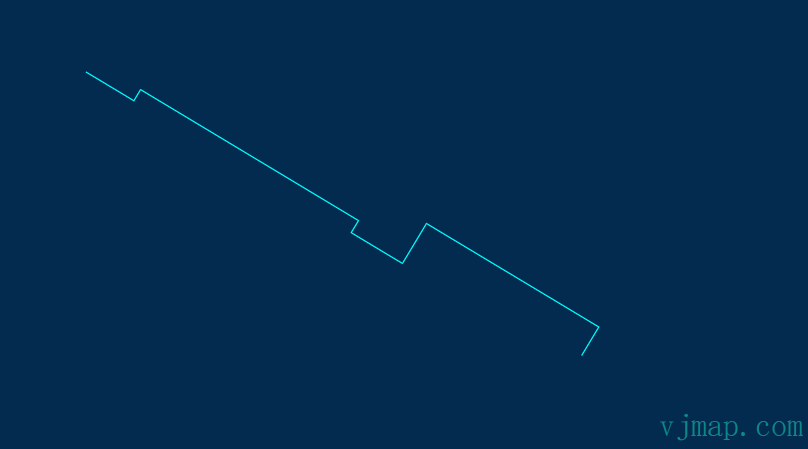
# Import GeoJSON
var geojson = {
    "type": "FeatureCollection",
    "features": [
        {
            "id": "1",
            "type": "Feature",
            "properties": {
                "color": "#00FFFF"
            },
            "geometry": {
                "coordinates": [
                    [
                        587680772.4127743,
                        3103807303.19205
                    ],
                    [
                        587681877.0860132,
                        3103809140.85324
                    ],
                    [
                        587670560.3140597,
                        3103815943.7041655
                    ],
                    [
                        587668980.1131245,
                        3103813314.986614
                    ],
                    [
                        587665615.6670034,
                        3103815337.456052
                    ],
                    [
                        587666093.402162,
                        3103816132.184601
                    ],
                    [
                        587651779.2146056,
                        3103824736.8719153
                    ],
                    [
                        587651338.2282269,
                        3103824003.2762012
                    ],
                    [
                        587648218.4697058,
                        3103825878.656586
                    ]
                ],
                "type": "LineString"
            }
        }
    ]
}
let model = vjgeo.importer.fromGeoJsonData(geojson)

let dwgDoc = vjgeo.exporter.toDWG(model);
2
3
4
5
6
7
8
9
10
11
12
13
14
15
16
17
18
19
20
21
22
23
24
25
26
27
28
29
30
31
32
33
34
35
36
37
38
39
40
41
42
43
44
45
46
47
48
49
50
51
52
53
54
55
56
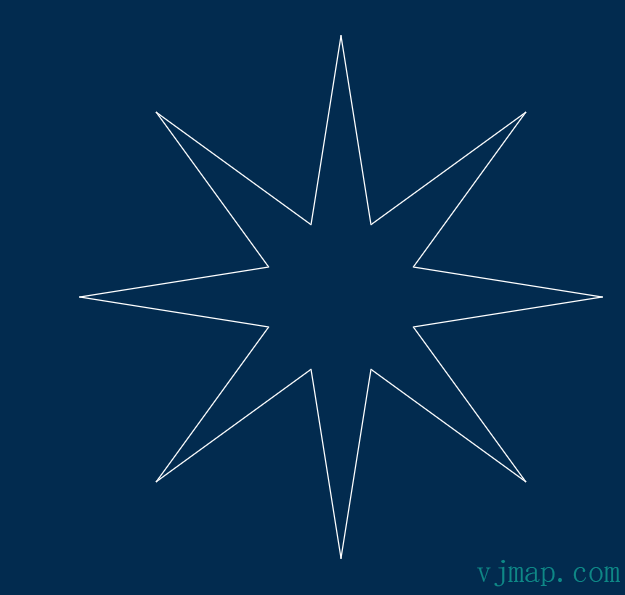
# Export DWG
var star = new vjgeo.models.Star(8, 50, 15, 2)
let dwgDoc = vjgeo.exporter.toDWG(star);
2
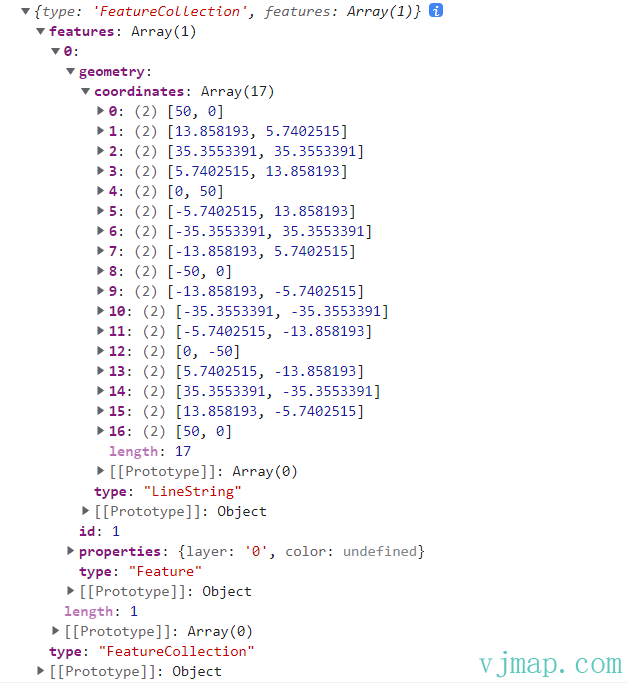
# Export GeoJSON
Add {isGeoJson: true} option when exporting DWG
var star = new vjgeo.models.Star(8, 50, 15, 2)
let geojson = vjgeo.exporter.toDWG(star, {isGeoJson: true});
2
# Export JSON
var star = new vjgeo.models.Star(8, 50, 15, 2)
let json = JSON.stringify(star);;
console.log(json)
2
3
# Model Tree Structure
A model is a tree structure that may contain paths and may contain other models in an inheritance relationship.
Example
var plate = {
    models: {
        outer: vjgeo.model.center(new vjgeo.models.RoundRectangle(120, 100, 10)),
        bolts: vjgeo.model.center(new vjgeo.models.BoltRectangle(100, 80, 5))
    },
    paths: {
        hole: new vjgeo.paths.Circle(25)
    }
};
let dwgDoc = vjgeo.exporter.toDWG(plate);
2
3
4
5
6
7
8
9
10
plate
+-models
| +-outer
| | +-paths
| |   +-TopLeft
| |   +-Top
| |   +-TopRight
| |   +-Left
| |   +-Right
| |   +-BottomLeft
| |   +-Bottom
| |   +-BottomRight
| +-bolts
|   +-paths
|     +-TopLeft_bolt
|     +-TopRight_bolt
|     +-BottomLeft_bolt
|     +-BottomRight_bolt
+paths
 +-hole
2
3
4
5
6
7
8
9
10
11
12
13
14
15
16
17
18
19
20
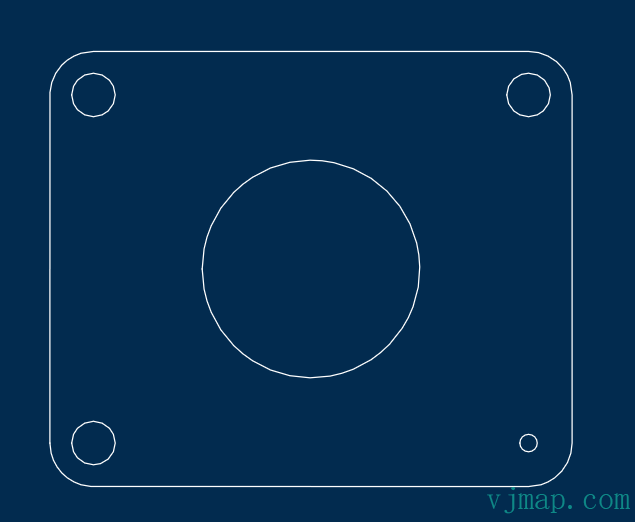
Starting from the root, we can easily traverse the tree. For example, let's change the radius of the BottomRight_bolt hole:
var plate = {
    models: {
        outer: vjgeo.model.center(new vjgeo.models.RoundRectangle(120, 100, 10)),
        bolts: vjgeo.model.center(new vjgeo.models.BoltRectangle(100, 80, 5))
    },
    paths: {
        hole: new vjgeo.paths.Circle(25)
    }
};
//change radius of BottomRight bolt hole
plate.models.bolts.paths.BottomRight_bolt.radius = 2;
let dwgDoc = vjgeo.exporter.toDWG(plate);
2
3
4
5
6
7
8
9
10
11
12
# Model Routing
We know we can use dot notation to reference deep objects:
var bottomRight_bolt = plate.models.bolts.paths.BottomRight_bolt;
The reference from plate to BottomRight_bolt is hardcoded. Suppose we have a plate2 that duplicates the plate model—we need to hardcode the reference to its BottomRight_bolt:
var bottomRight_bolt2 = plate2.models.bolts.paths.BottomRight_bolt;
Instead of hardcoded dot notation, we can use routing to reference deep objects in an abstract way. It is simply an array of strings representing the segment names between points. We don't put the root object in the route. The route we can apply to both plate and plate2 is:
var route = ["models", "bolts", "paths", "BottomRight_bolt"];
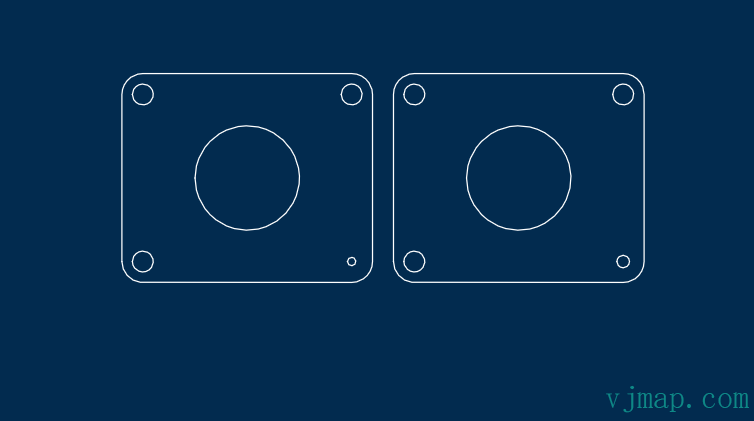
Locate the model by route array keys:
var plate = {
    models: {
        outer: vjgeo.model.center(new vjgeo.models.RoundRectangle(120, 100, 10)),
        bolts: vjgeo.model.center(new vjgeo.models.BoltRectangle(100, 80, 5))
    },
    paths: {
        hole: new vjgeo.paths.Circle(25)
    }
};

var plate2 = vjgeo.cloneObject(plate);
plate2.origin = [130, 0];

// route to the BottomRight_bolt circle
var route = ["models", "bolts", "paths", "BottomRight_bolt"];

//create a local variables for BottomRight_bolt holes
var bottomRight_bolt = vjgeo.travel(plate, route).result;
bottomRight_bolt.radius = 2;

var bottomRight_bolt2 = vjgeo.travel(plate2, route).result;
bottomRight_bolt2.radius = 3;

var plates = {
    models: {
        plate: plate,
        plate2: plate2
    }
};

let dwgDoc = vjgeo.exporter.toDWG(plates);
2
3
4
5
6
7
8
9
10
11
12
13
14
15
16
17
18
19
20
21
22
23
24
25
26
27
28
29
30
31
# Traversing the Model Tree
You can traverse the model tree by calling vjgeo.model.walk with your model and an object with the following optional properties:
# walkPath object
The walkPath object has the following properties:
- layer: The layer name containing this path (if any).
- modelContext: The model containing this path.
- offset: The absolute coordinates of [0, 0] for this path.
- pathContext: The path itself.
- pathId: The ID of this path in its parent model.paths container.
- route: Array of property names to locate this path from the tree root.
- routeKey: String representation of the route, safe to use as a unique key for this path.
# walkModel object
The walkModel object has the following properties:
- childId: The ID of this model in its parent model.models container.
- childModel: The model itself
- layer: The layer name containing this path (if any).
- offset: The absolute coordinates of [0, 0] for this model.
- parentModel: The model containing this model.
- route: Array of property names to locate this model from the tree root.
- routeKey: String representation of the route, safe to use as a unique key for this model.
We will create a RoundRectangle and traverse its tree. We have an onPath function that will be called for each path in the model. If the path is an arc, we reverse it:
function invertArc(arc) {
  var chord = new vjgeo.paths.Chord(arc);
  var midPoint = vjgeo.point.middle(chord);
  vjgeo.path.rotate(arc, 180, midPoint);
}

var shape = new vjgeo.models.RoundRectangle(100, 50, 10);

var walkOptions = {
  onPath: function (wp) {
    if (wp.pathContext.type === 'arc') {
      invertArc(wp.pathContext);
    }
  }
};

vjgeo.model.walk(shape, walkOptions);
let dwgDoc = vjgeo.exporter.toDWG(shape);
2
3
4
5
6
7
8
9
10
11
12
13
14
15
16
17
18
# Chain
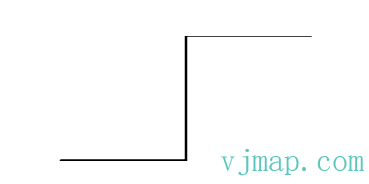
When 2 or more paths connect end to end, we call it a chain. Here 3 lines connect end to end to form a chain with 3 links; each line path is considered a link in the chain:
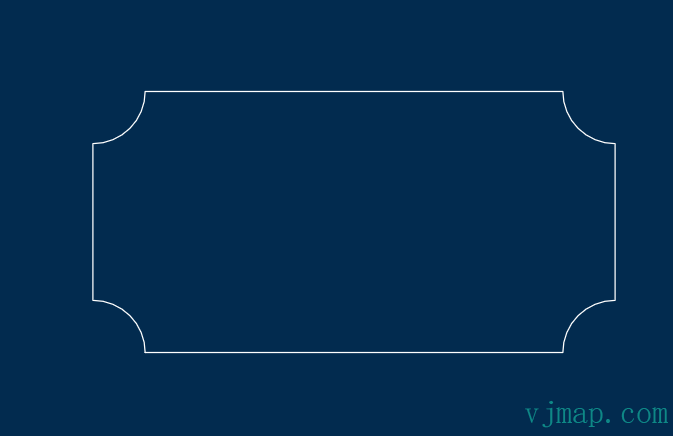
When links have no loose ends and connect to each other, we call it a loop chain. Typically, loop chains are used to represent a closed geometry. This is a loop chain made of 2 lines and one arc:
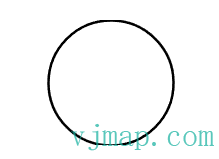
A circle is essentially a closed geometry. In vjgeo, a circle contains a loop chain with only one link.
A chain can recursively contain other chains. If a chain itself is a loop chain, it can only contain other chains. Here are some examples of a chain containing another chain:
This is a model without any chains. Although the lines overlap, they do not connect end to end.
# Find Single Chain
Let's start by drawing a rectangle. A rectangle is a model, but we also implicitly know that a rectangle consists of 4 paths connected end to end. Let's now use vjgeo.model.findSingleChain(model) to find this chain:
var model = new vjgeo.models.Rectangle(100, 50);
let dwgDoc = vjgeo.exporter.toDWG(model);
//now find the chain
var chain = vjgeo.model.findSingleChain(model);
document.write('found a chain with ' + chain.links.length + ' links and endless=' + chain.endless);
2
3
4
5
found a chain with 4 links and endless=true
Now, let's combine two rectangle models into a union. Note that since the two rectangle models are independent, the chain will continue unconstrained
var drawing = {
    models: {
        r1: new vjgeo.models.Rectangle(100, 50),
        r2: vjgeo.model.move(new vjgeo.models.Rectangle(100, 50), [50, 25])
    }
};
vjgeo.model.combineUnion(drawing.models.r1, drawing.models.r2);
let dwgDoc = vjgeo.exporter.toDWG(drawing);

//now find the chain
var chain = vjgeo.model.findSingleChain(drawing);
document.write('found a chain with ' + chain.links.length + ' links and endless=' + chain.endless);
2
3
4
5
6
7
8
9
10
11
12
13
found a chain with 8 links and endless=true
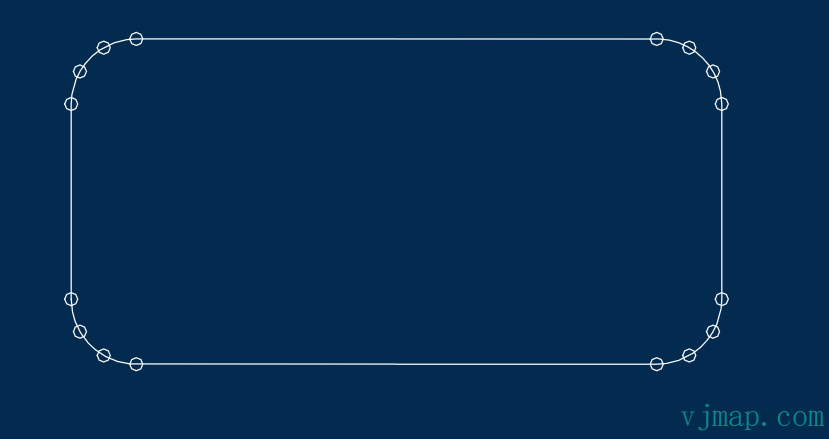
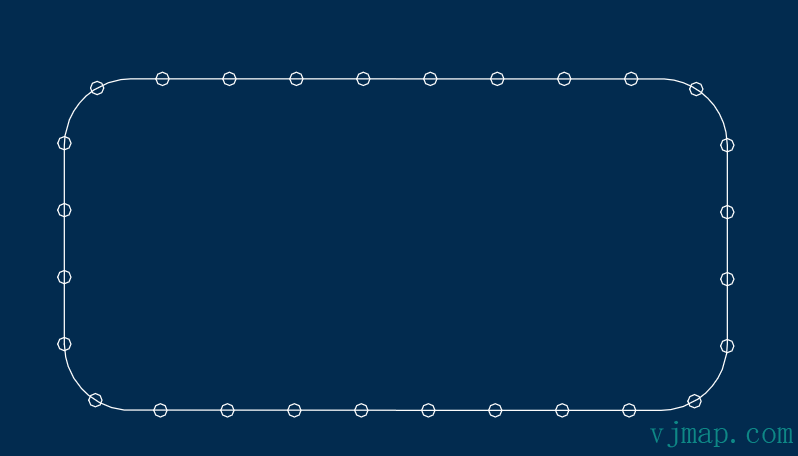
# Chain Key Points
Call vjgeo.model.toKeyPoints(chain, [optional] maxArcFacet) passing your chain and the maximum facet length on arcs and circles:
var rect = new vjgeo.models.RoundRectangle(100, 50, 10);
var chain = vjgeo.model.findSingleChain(rect);
var keyPoints = vjgeo.chain.toKeyPoints(chain, 5);
var model = {
  models: {
    rect: rect,
    dots: new vjgeo.models.Holes(1, keyPoints)
  }
};
let dwgDoc = vjgeo.exporter.toDWG(model);
2
3
4
5
6
7
8
9
10
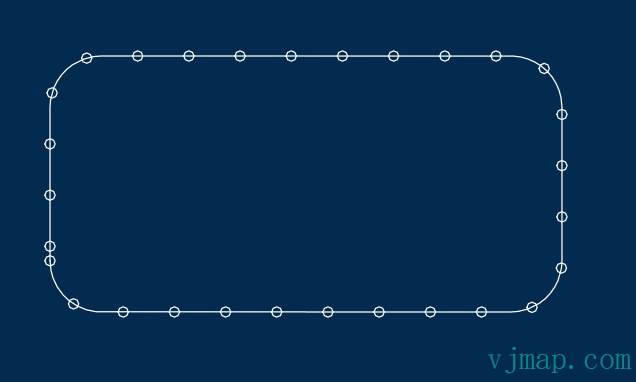
To make points evenly spaced along the chain, call vjgeo.model.toPoints(chain, distance) passing your chain and the distance between points:
var rect = new vjgeo.models.RoundRectangle(100, 50, 10);
var chain = vjgeo.model.findSingleChain(rect);
var spacing = 10;
var keyPoints = vjgeo.chain.toPoints(chain, spacing);
var model = {
  models: {
    rect: rect,
    dots: new vjgeo.models.Holes(1, keyPoints)
  }
};
let dwgDoc = vjgeo.exporter.toDWG(model);
2
3
4
5
6
7
8
9
10
11
You can use the chain's pathLength property to ensure your distance is evenly distributed across the entire chain:
var rect = new vjgeo.models.RoundRectangle(100, 50, 10);

var chain = vjgeo.model.findSingleChain(rect);
var minimumSpacing = 10;
var divisions = Math.floor(chain.pathLength / minimumSpacing);
var spacing = chain.pathLength / divisions;

console.log(spacing);

var keyPoints = vjgeo.chain.toPoints(chain, spacing);

var model = {
  models: {
    rect: rect,
    dots: new vjgeo.models.Holes(1, keyPoints)
  }
};
let dwgDoc = vjgeo.exporter.toDWG(model);
2
3
4
5
6
7
8
9
10
11
12
13
14
15
16
17
18
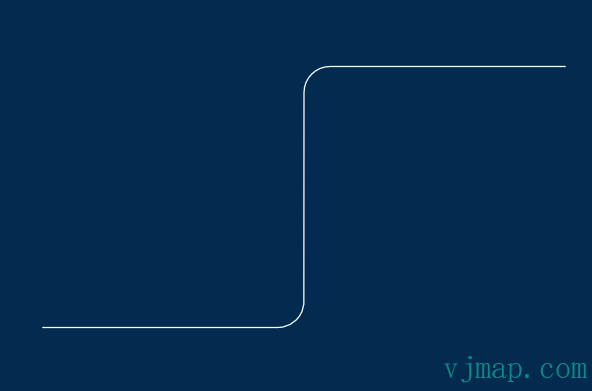
# Chain Fillet
Add fillets between all paths in a chain by calling vjgeo.chain.fillet with these parameters:
- chainToFillet: The chain containing paths that will be modified to have fillets at their joints.
- filletRadius: The radius of the fillet. This will modify all paths in the chain to accommodate arcs between them, and it will return a new model containing all the fitted fillets. This new model should be added to your tree.
var model = {
	paths: {
	"0": new vjgeo.paths.Line([0, 0], [100, 0]),
	"1": new vjgeo.paths.Line([100, 0], [100, 100]),
	"2": new vjgeo.paths.Line([100, 100], [200, 100])
	},

	//create a placeholder in the tree for more models
	models: {}
};
//find the chain
var chain = vjgeo.model.findSingleChain(model);
//add fillets to the chain
var filletsModel = vjgeo.chain.fillet(chain, 10);
//put the fillets in the tree
model.models.fillets = filletsModel;
let dwgDoc = vjgeo.exporter.toDWG(model);
2
3
4
5
6
7
8
9
10
11
12
13
14
15
16
17
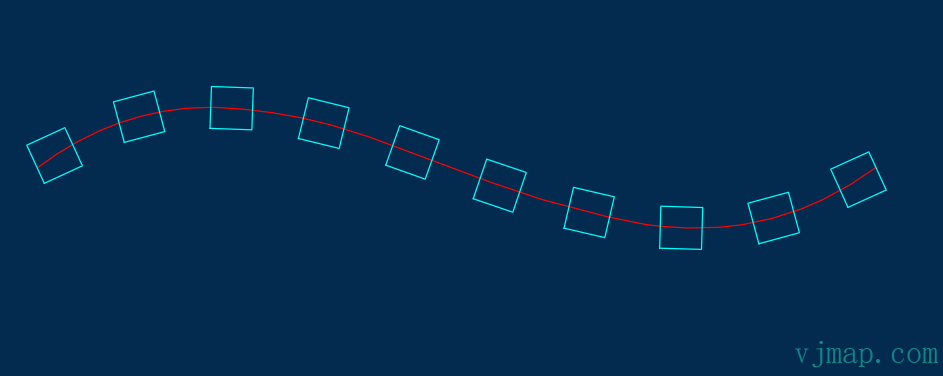
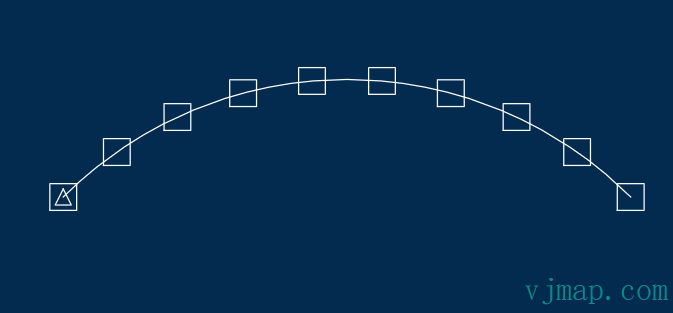
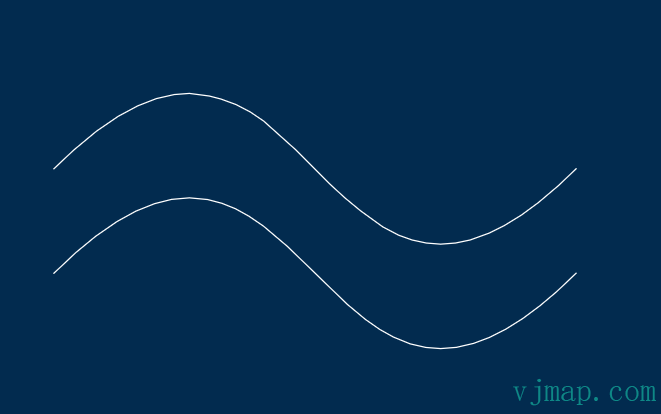
# Chain Layout
Similar to path layout, you can use a chain as a layout guide for a row of child models in a model. Call vjgeo.layout.childrenOnChain(parentModel: Model, onChain: chain); the x-axis will be projected onto your onChain:
var square = new vjgeo.models.Square(5);
var row = vjgeo.layout.cloneToRow(square, 10, 10);
var curve = new vjgeo.models.BezierCurve([0, 0], [33, 25], [66, -25], [100, 0]);
var chain = vjgeo.model.findSingleChain(curve);
vjgeo.layout.childrenOnChain(row, chain, 0.5, false, true);

var model = {
    models: {
        curve: curve,
        row: row
    }
};

curve.data.colorIndex = vjgeo.exporter.colors.red;
row.data = {
	color: 0x00FFFF
}
let dwgDoc = vjgeo.exporter.toDWG(model);
2
3
4
5
6
7
8
9
10
11
12
13
14
15
16
17
18