# leaflet
# Introduction
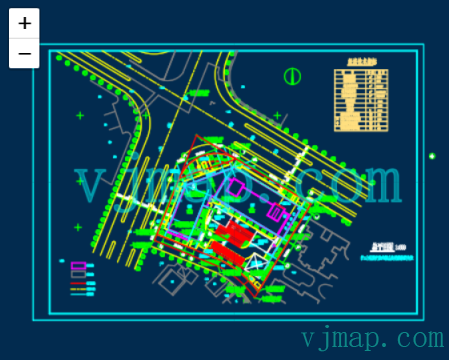
The previous section introduced loading DWG-format CAD maps with OpenLayers and overlaying them on web maps. OpenLayers is comprehensive but also large and has a steeper learning curve, making it suitable for medium to large projects. For small to medium projects, the open-source Leaflet is commonly used. Leaflet is lightweight, elegant, and has many plugins. This document describes how to load DWG-format CAD maps with Leaflet and build applications such as overlaying them on web maps.
# Leaflet Introduction
Leaflet is a leading open-source JavaScript library for mobile-friendly interactive maps. At about 39KB of JS, it provides most of the map functionality developers need. Leaflet is designed for simplicity, performance, and usability. It works efficiently on major desktop and mobile platforms, can be extended with many plugins, and has a well-documented, easy-to-use API with readable source code.
Leaflet official site: https://leafletjs.com/ (opens new window)
Leaflet source code: [https://github.com/Leaflet/](https://github.com/Leaflet/
# Loading CAD Raster Tiles in Leaflet
To load CAD maps in Leaflet, you need a coordinate system based on the CAD map. You can extend L.CRS.Simple and set the coordinate system extent, resolution, and transform parameters.
// Map service object, call Vijmap service to open map and get map metadata
let svc = new vjmap.Service(env.serviceUrl, env.accessToken)
// Open map
let mapId = "sys_zp";
let res = await svc.openMap({
    mapid: mapId, // Map ID
    mapopenway: vjmap.MapOpenWay.GeomRender, // Open with geometry data rendering
    style: vjmap.openMapDarkStyle() // Use dark background style when div has dark background
})
if (res.error) {
    // If open fails
    message.error(res.error)
}
// Get map bounds
let mapBounds = vjmap.GeoBounds.fromString(res.bounds);

// Create coordinate system based on CAD map extent
let CadCRS = L.Class.extend({
    includes: L.CRS.Simple,
    initialize: function (bounds) {
        // Current CAD map extent
        this.bounds = bounds;
        // Projection
        this.projection = L.Projection.LonLat;
        // Compute resolution
        let r = (256 / Math.abs(this.bounds.getEast() - this.bounds.getWest()));
        // Set transform parameters: affine transform coefficients a, b, c, d to transform (x, y) to (ax + b, cy + d) and inverse
        this.transformation = new L.Transformation(r, -r * this.bounds.getWest(),  - r,  r * this.bounds.getNorth());
    }
});

// Leaflet coordinates are reversed. Use L.latLng with [y,x] or see https://leafletjs.com/examples/crs-simple/crs-simple.html
L.XY = function(x, y) {
    if (L.Util.isArray(x)) {    // When doing XY([x, y]);
        return L.latLng(x[1], x[0]);
    }
    return L.latLng(y, x);  // When doing XY(x, y);
};

// Current CAD map extent
let bounds = new L.LatLngBounds([L.XY(mapBounds.min.toArray()), L.XY(mapBounds.max.toArray())]);
let center = mapBounds.center(); // Map center

// Create Leaflet map object
let map = L.map('map', {
    // Coordinate system
    crs: new CadCRS(bounds),
    attributionControl: false
}).setView(L.XY([center.x, center.y]), 2); // Set initial center and zoom
// For L.latLng, swap x,y: map.setView(L.latLng([center.y, center.x]), 2);

// Add raster tile layer
let layer = L.tileLayer(
    svc.rasterTileUrl(),  // Vijmap CAD raster tile URL
    {
        bounds: bounds // Current CAD map extent
    }
).addTo(map);
// Add layer to map
layer.addTo(map);
2
3
4
5
6
7
8
9
10
11
12
13
14
15
16
17
18
19
20
21
22
23
24
25
26
27
28
29
30
31
32
33
34
35
36
37
38
39
40
41
42
43
44
45
46
47
48
49
50
51
52
53
54
55
56
57
58
59
60
# Selecting and Highlighting CAD Entities in Leaflet
Selection and highlight: handle map click, query entity data at the click position, then draw the returned GeoJSON with Leaflet's geoJSON.
let highlightLayer; // Highlight layer
const highlight_ent = async co => {
    if (highlightLayer) {
        highlightLayer.remove(); // Remove previous highlight
        highlightLayer = null;
    }
    let res = await svc.pointQueryFeature({
        x: co[0],
        y: co[1],
        zoom: map.getZoom(),
        fields: ""
    }, pt => {
        // Coordinate conversion callback for each queried point
        return mapPrj.fromMercator(pt);// Convert to CAD coordinates
    })
    if (res && res.result && res.result.length > 0) {
        let features = [];
        for (let ent of res.result) {
            if (ent.geom && ent.geom.geometries) {
                let clr = vjmap.entColorToHtmlColor(ent.color);
                for (let g = 0; g < ent.geom.geometries.length; g++) {
                    features.push({
                        type: "Feature",
                        properties: {
                            objectid: ent.objectid + "_" + g,
                            color: clr,
                            alpha: ent.alpha / 255,
                            lineWidth: 1,
                            name: ent.name,
                            isline: ent.isline,
                            layerindex: ent.layerindex
                        },
                        geometry: ent.geom.geometries[g]
                    })
                }
                // Selection hint
                let content = `feature: ${ent.objectid}; layer: ${cadLayers[ent.layerindex].name}; type: ${ent.name}`
                message.info({ content, key: "info", duration: 3});
            }
        }
        let data = {
            type: "FeatureCollection",
            features: features
        }
        if (data.features.length > 0) {
            highlightLayer = L.geoJSON(data, {
                style: function (feature) {
                    const highlightColor = svc.currentMapParam().darkMode ? "#57FFC9" : "#11F";
                    return {color: highlightColor, fillColor: highlightColor}; // feature.properties.color
                }
            })
            highlightLayer.addTo(map);
        }
    }
};
2
3
4
5
6
7
8
9
10
11
12
13
14
15
16
17
18
19
20
21
22
23
24
25
26
27
28
29
30
31
32
33
34
35
36
37
38
39
40
41
42
43
44
45
46
47
48
49
50
51
52
53
54
55
56
57
58
# Uploading and Opening CAD DWG in Leaflet
// Map service object, call Vijmap service to open map and get map metadata
let svc = new vjmap.Service(env.serviceUrl, env.accessToken)

// Upload dwg file
const uploadDwgFile = async file => {
    message.info("Uploading drawing, please wait", 2);
    let res = await svc.uploadMap(file); // Upload map
    // Enter map id
    let mapid = prompt("Please enter map name ID", res.mapid);
    res.mapid = mapid;
    res.mapopenway = vjmap.MapOpenWay.GeomRender; // Geometry render, use vjmap.MapOpenWay.Memory for memory render
    res.isVector = false; // Use raster tiles
    res.style = vjmap.openMapDarkStyle(); // Dark style, use openMapDarkStyle for light
    message.info("Opening drawing, please wait. First open may take tens of seconds to several minutes depending on size", 5);
    let data = await svc.openMap(res); // Open map
    if (data.error) {
        message.error(data.error)
        return;
    }
    openMap(data);
}
2
3
4
5
6
7
8
9
10
11
12
13
14
15
16
17
18
19
20
21
22
# Switching CAD Layers in Leaflet
Call the backend to switch CAD layers, get the new layer style id, then update the Leaflet raster layer tile URL.
// Switch layer
const switchLayer = async layers => {
    let res = await svc.cmdSwitchLayers(layers); // Call Vijmap service to switch layers, returns {layerid: "xxxx"}
    layer.setUrl(svc.rasterTileUrl()); // Reset Vijmap CAD raster tile URL
}
2
3
4
5
# Switching CAD Maps in Leaflet
Create a new div, instantiate a new map, and associate it with the new div.
const switchToMapId = async (mapId)=> {
    let res = await svc.openMap({
        mapid: mapId, // Map ID
        mapopenway: vjmap.MapOpenWay.GeomRender, // Open with geometry data rendering
        style: vjmap.openMapDarkStyle() // Use dark background style when div has dark background
    })
    if (res.error) {
        // If open fails
        message.error(res.error)
        return;
    }
    // Get map bounds
    let mapBounds = vjmap.GeoBounds.fromString(res.bounds);
    let mapPrj = new vjmap.GeoProjection(mapBounds);

    // Create coordinate system based on CAD map extent
    let CadCRS = L.Class.extend({
        includes: L.CRS.Simple,
        initialize: function (bounds) {
            // Current CAD map extent
            this.bounds = bounds;
            // Projection
            this.projection = L.Projection.LonLat;
            // Compute resolution
            let r = (256 / Math.abs(this.bounds.getEast() - this.bounds.getWest()));
            // Set transform parameters
            this.transformation = new L.Transformation(r, -r * this.bounds.getWest(), -r, r * this.bounds.getNorth());
        }
    });


    // Current CAD map extent
    let bounds = new L.LatLngBounds([L.XY(mapBounds.min.toArray()), L.XY(mapBounds.max.toArray())]);
    let center = mapBounds.center(); // Map center

    // Create Leaflet map object
    map = L.map(createNewMapDivId(), {
        // Coordinate system
        crs: new CadCRS(bounds),
        attributionControl: false
    }).setView(L.XY([center.x, center.y]), 2); // Set initial center and zoom
    // For L.latLng, swap x,y: map.setView(L.latLng([center.y, center.x]), 2);

    // Add raster tile layer
    let layer = L.tileLayer(
        svc.rasterTileUrl(),  // Vijmap CAD raster tile URL
        {
            bounds: bounds // Current CAD map extent
        }
    ).addTo(map);
    // Add layer to map
    layer.addTo(map);

    map.on('click', (e) => message.info({content: `Clicked coordinate: ${e.latlng.lng}, ${e.latlng.lat}}`, key: "info", duration: 3}));
}
2
3
4
5
6
7
8
9
10
11
12
13
14
15
16
17
18
19
20
21
22
23
24
25
26
27
28
29
30
31
32
33
34
35
36
37
38
39
40
41
42
43
44
45
46
47
48
49
50
51
52
53
54
55
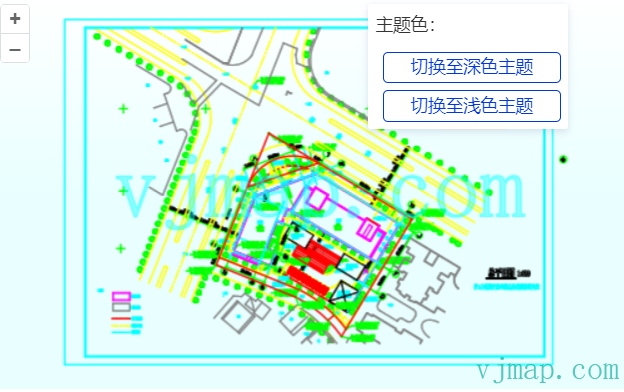
# Dark/Light Theme Switching in Leaflet
Update backend style, then set the Leaflet raster layer tile URL from the returned style name.
let curIsDarkTheme = true;
const switchToDarkTheme = async () => {
    if (curIsDarkTheme) return;
    curIsDarkTheme = true;
    document.body.style.background = "#022B4F"; // Change background to dark
    await updateStyle(curIsDarkTheme)
}

const switchToLightTheme = async () => {
    if (!curIsDarkTheme) return;
    curIsDarkTheme = false;
    document.body.style.backgroundImage = "linear-gradient(rgba(255, 255, 255, 1), rgba(233,255,255, 1), rgba(233,255,255, 1))"
    await updateStyle(curIsDarkTheme)
}

const updateStyle = async (isDarkTheme) => {
    style.backcolor = isDarkTheme ? 0 : 0xFFFFFF;// Black for dark, white for light
    let res = await svc.cmdUpdateStyle(style);
    layer.setUrl(svc.rasterTileUrl()) // Vijmap CAD raster tile URL
}
2
3
4
5
6
7
8
9
10
11
12
13
14
15
16
17
18
19
20
# Custom CAD Map Style in Leaflet
Customize the map by modifying CAD map backend style data.
// Change style
const expressionList = [] ;// Expression array
const updateStyle = async (style) => {
    let res = await svc.cmdUpdateStyle({
        name: "customStyle2",
        backcolor: 0,
        expression: expressionList.join("\n"),
        ...style
    });
    layer.setUrl(svc.rasterTileUrl());  // Vijmap CAD raster tile URL
}

// For expression syntax and variables, refer to
// Server-side condition query and expression query https://vjmap.com/guide/svrStyleVar.html
// Server-side render expression syntax https://vjmap.com/guide/expr.html

// Modify color: red color.r, green color.g, blue color.b, alpha color.a. If zoom provided, applies to that level and above
const modifyColor = (color, zoom) => {
    let result = "";
    let z = Number.isInteger(zoom) ? `[${zoom + 1}]` : '';
    if ("r" in color) result += `gOutColorRed${z}:=${color.r};`;
    if ("g" in color) result += `gOutColorGreen${z}:=${color.g};`;
    if ("b" in color) result += `gOutColorBlue${z}:=${color.b};`;
    if ("a" in color) result += `gOutColorAlpha${z}:=${color.a};`;
    return result;
}
2
3
4
5
6
7
8
9
10
11
12
13
14
15
16
17
18
19
20
21
22
23
24
25
26
27
# CAD Map Composition in Leaflet
Combine multiple CAD maps with layer visibility, clipping, rotation, and scaling into a new CAD map.
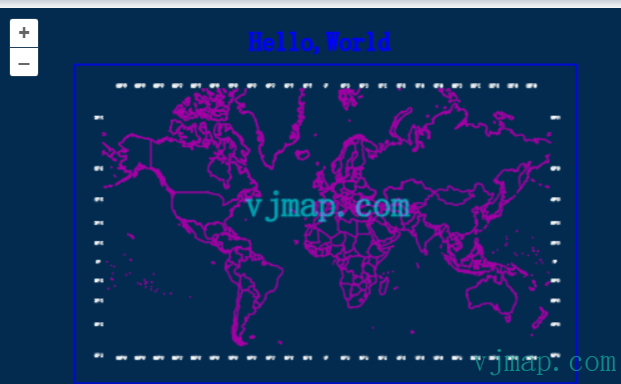
// Compose new map: process sys_world, then combine with sys_hello to generate new map file name
let rsp = await svc.composeNewMap([
    {
        mapid: "sys_world", // Map id
        // Set parameters below as needed
        layers: ["latlon labels","COUNTRY"], // Layer names to display
        //clipbounds: [10201.981489534268, 9040.030491346213, 26501.267379,  4445.465999], // Extent to display
        //fourParameter: [0,0,1,0] // Four-parameter transform
    },
    {
        mapid: "sys_hello"
    }
])
if (!rsp.status) {
    message.error(rsp.error)
}
// Result:
/*
{
    "fileid": "pec9c5f73f1d",
    "mapdependencies": "sys_world||sys_hello",
    "mapfrom": "sys_world&&v1&&&&0&&&&&&&&&&00A0&&10||sys_hello&&v1&&&&0&&&&&&&&&&&&2",
    "status": true
}
 */
2
3
4
5
6
7
8
9
10
11
12
13
14
15
16
17
18
19
20
21
22
23
24
25
26
# Querying All Text in Map and Drawing Bounds in Leaflet
Use condition query to fetch all text attributes and GeoJSON, then draw each text's bounds with Leaflet's GeoJSON layer.
let highlightLayer; // Highlight layer
const queryTextAndDrawBounds = async () => {
    if (highlightLayer) {
        highlightLayer.remove(); // Remove previous highlight
        highlightLayer = null;
    }
    let queryTextEntTypeId = getTypeNameById("AcDbText"); // Single-line text
    let queryMTextEntTypeId = getTypeNameById("AcDbMText"); // Multi-line text
    let queryAttDefEntTypeId = getTypeNameById("AcDbAttributeDefinition"); // Attribute definition text
    let queryAttEntTypeId = getTypeNameById("AcDbAttribute"); // Attribute text
    let query = await svc.conditionQueryFeature({
        condition: `name='${queryTextEntTypeId}' or name='${queryMTextEntTypeId}' or name='${queryAttDefEntTypeId}' or name='${queryAttEntTypeId}'`, // Only write SQL WHERE clause
        fields: "",
        limit: 100000 // Large value to fetch all
    }, pt => {
        // Coordinate conversion callback for each queried point
        return mapPrj.fromMercator(pt);// Convert to CAD coordinates
    })
    if (query.error) {
        message.error(query.error)
    } else {
        message.info(`Query matched count: ${query.recordCount}`)

        if (query.recordCount > 0) {
            let features = [];
            for(var i = 0; i < query.recordCount; i++) {
                let bounds = vjmap.getEnvelopBounds(query.result[i].envelop, mapPrj);
                let clr = vjmap.entColorToHtmlColor(query.result[i].color); // Entity color to HTML color

                features.push({
                    type: "Feature",
                    properties: {
                        name: "objectid:" + query.result[i].objectid,
                        color: clr
                    },
                    geometry: {
                        'type': 'Polygon',
                        'coordinates': [
                            bounds.toPointArray(),
                        ],
                    }
                })
            }


            let data = {
                type: "FeatureCollection",
                features: features
            }
            if (data.features.length > 0) {
                highlightLayer = L.geoJSON(data, {
                    style: function (feature) {
                        return {color: "#FF6EA0", fillColor: "#FF6EA0", fillOpacity: 0.4}; // feature.properties.color
                    }
                })
                highlightLayer.addTo(map);
            }
        }
    }
}
2
3
4
5
6
7
8
9
10
11
12
13
14
15
16
17
18
19
20
21
22
23
24
25
26
27
28
29
30
31
32
33
34
35
36
37
38
39
40
41
42
43
44
45
46
47
48
49
50
51
52
53
54
55
56
57
58
59
60
61
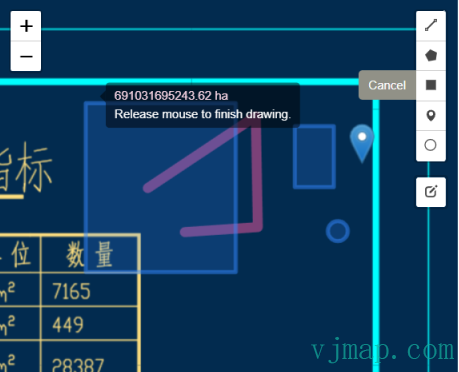
# Drawing in Leaflet
Use the Leaflet.draw plugin: https://github.com/Leaflet/Leaflet.draw
var editableLayers = new L.FeatureGroup();
map.addLayer(editableLayers);

var MyCustomMarker = L.Icon.extend({
    options: {
        shadowUrl: null,
        iconAnchor: new L.Point(12, 41),
        iconSize: new L.Point(25, 41),
        iconUrl: './js/leaflet2.0/plugins/images/marker-icon.png'
    }
});

var options = {
    position: 'topright',
    draw: {
        polyline: {
            shapeOptions: {
                color: '#f357a1',
                weight: 10
            }
        },
        polygon: {
            allowIntersection: false, // Restricts shapes to simple polygons
            drawError: {
                color: '#e1e100', // Color the shape will turn when intersects
                message: '<strong>Oh snap!<strong> you can\'t draw that!' // Message that will show when intersect
            },
            shapeOptions: {
                color: '#bada55'
            }
        },
        circle: false, // Turns off this drawing tool
        rectangle: {
            shapeOptions: {
                clickable: false
            }
        },
        marker: {
            icon: new MyCustomMarker()
        }
    },
    edit: {
        featureGroup: editableLayers, //REQUIRED!!
        remove: false
    }
};

var drawControl = new L.Control.Draw(options);
map.addControl(drawControl);

map.on(L.Draw.Event.CREATED, function (e) {
    var type = e.layerType,
        layer = e.layer;

    if (type === 'marker') {
        layer.bindPopup('A popup!');
    }

    editableLayers.addLayer(layer);
});
2
3
4
5
6
7
8
9
10
11
12
13
14
15
16
17
18
19
20
21
22
23
24
25
26
27
28
29
30
31
32
33
34
35
36
37
38
39
40
41
42
43
44
45
46
47
48
49
50
51
52
53
54
55
56
57
58
59
60
61
62
63
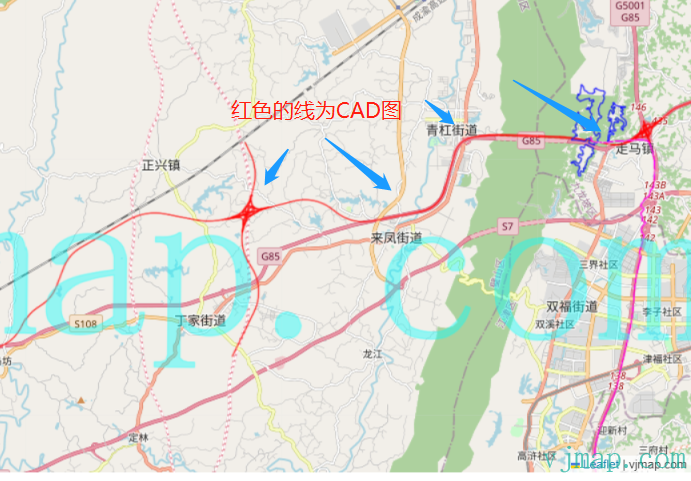
# CAD Map Overlaid on Web Map in Leaflet [CAD as Base]
// Add Amap base
let gdlayer;
const addGaodeMap = async (isRoadway) => {
    const tileUrl = svc.webMapUrl({
        tileCrs: "gcj02",
        tileUrl:  isRoadway ? [
                "https://webrd0{s}.is.autonavi.com/appmaptile?lang=zh_cn&size=1&scale=1&style=8&x={x}&y={y}&z={z}"
            ] :
            /* For imagery */
            [
                "https://webst0{s}.is.autonavi.com/appmaptile?lang=zh_cn&size=1&scale=1&style=6&x={x}&y={y}&z={z}",
                "https://webst0{s}.is.autonavi.com/appmaptile?lang=zh_cn&size=1&scale=1&style=8&x={x}&y={y}&z={z}"
            ],
        tileSize: 256,
        tileRetina: 1,
        tileMaxZoom: 18,
        tileShards: "1,2,3,4",
        tileToken: "",
        tileFlipY: false,
        mapbounds: res.bounds,
        srs: "EPSG:4527",// Get via vjmap.transform.getEpsgParam(vjmap.transform.EpsgCrsTypes.CGCS2000, 39).epsg
        // sys_cad2000 has 6 digits without zone. Need zone offset before transform https://blog.csdn.net/thinkpang/article/details/124172626
        fourParameterBefore: "39000000,0,1,0"
    })

    gdlayer = L.tileLayer(
        tileUrl,
        {
            zIndex: 0
        }
    );
    gdlayer.addTo(map);


    // CAD and web coordinate conversion example
    let webCo = await cad2webCoordinate(center, false); // CAD to web
    let cadCo = await web2cadCoordinate(webCo, false); // Web to CAD
    console.log(center, webCo, cadCo)
}
2
3
4
5
6
7
8
9
10
11
12
13
14
15
16
17
18
19
20
21
22
23
24
25
26
27
28
29
30
31
32
33
34
35
36
37
38
39
40
# Auto Overlay CAD on Web Map in Leaflet [Web Map as Base]
let cadEpsg = "EPSG:4544";// CAD map EPSG code
// Add CAD WMS layer
let wmsUrl = svc.wmsTileUrl({
    mapid: mapId, // Map id
    layers: layer, // Layer name
    bbox: '', // bbox not needed here
    srs: "EPSG:3857", //
    crs: cadEpsg,
})

let mapBounds = vjmap.GeoBounds.fromString(res.bounds);
// CAD to web WGS84 coordinate
const cadToWebCoordinate = async point => {
    let co = await svc.cmdTransform(cadEpsg, "EPSG:4326", point);
    return co[0]
}

// Add WMS layer
let wmsLayer = L.tileLayer.wms(wmsUrl, {
    attribution: "vjmap.com"
});
wmsLayer.addTo(map);
2
3
4
5
6
7
8
9
10
11
12
13
14
15
16
17
18
19
20
21
22
# Overlaying CAD on Web Map by Common Points in Leaflet [Web Map as Base]
// Points on CAD
let cadPoints = [
    vjmap.geoPoint([587464448.8435847, 3104003685.208651,]),
    vjmap.geoPoint([587761927.7224838, 3104005967.655292]),
    vjmap.geoPoint([587463688.0280377, 3103796743.3798513]),
    vjmap.geoPoint([587760406.0913897, 3103793700.1176634])
];


// Corresponding points picked on web map (WGS84)
let webPoints = [
    vjmap.geoPoint([116.48476281710168, 39.96200739703454]),
    vjmap.geoPoint([116.48746772021137, 39.96022062215167]),
    vjmap.geoPoint([116.48585059441585, 39.9588451134361]),
    vjmap.geoPoint([116.48317418949145, 39.960515760972356])
]


// Compute four-parameter from point pairs
let epsg3857Points = webPoints.map(w => vjmap.geoPoint(vjmap.Projection.lngLat2Mercator(w)));
let param = vjmap.coordTransfromGetFourParamter(epsg3857Points, cadPoints , false); // Consider rotation
let fourparam = [param.dx, param.dy, param.scale, param.rotate]

// WMS layer URL
const getCadWmsUrl = (transparent) => {
    let wmsUrl = svc.wmsTileUrl({
        mapid: mapId, // Map id
        layers: layer, // Layer name
        bbox: '', // bbox not needed here
        fourParameter: fourparam,
        transparent: transparent,
        backgroundColor: 'rgba(240, 255, 255)' // For non-transparent
    })
    return wmsUrl
}


let mapBounds = vjmap.GeoBounds.fromString(res.bounds);
let cadPrj = new vjmap.GeoProjection(mapBounds);


// CAD to WGS84 coordinate
const cadToWebCoordinate = point => {
    // Inverse four-parameter to get web coordinate
    let mkt = vjmap.coordTransfromByInvFourParamter(vjmap.geoPoint(point), param);
    return vjmap.Projection.mercator2LngLat(mkt);
}
// WGS84 to CAD coordinate
const webToCadCoordinate = point => {
    let mkt = vjmap.Projection.lngLat2Mercator(vjmap.geoPoint(point));
    return vjmap.coordTransfromByFourParamter(mkt, param)
}
let VisibleBounds = mapBounds.scale(0.4);
let pt1 =  cadToWebCoordinate([VisibleBounds.min.x, VisibleBounds.min.y])
let pt2 =  cadToWebCoordinate([VisibleBounds.min.x, VisibleBounds.max.y])
let pt3 =  cadToWebCoordinate([VisibleBounds.max.x, VisibleBounds.max.y])
let pt4 =  cadToWebCoordinate([VisibleBounds.max.x, VisibleBounds.min.y])
// Compute CAD extent
let bounds = vjmap.GeoBounds.fromDataExtent([pt1, pt2, pt3, pt4])


let wmsLayer;
const addWmsLayer = async (transparent)=> {
    removeWmsLayer();
    let wmsUrl = getCadWmsUrl(transparent);
    wmsLayer = L.tileLayer.wms(wmsUrl, {
        attribution: "vjmap.com"
    });
    wmsLayer.addTo(map);
}

const removeWmsLayer = ()=> {
    if (!wmsLayer) return;
    wmsLayer.remove();
    wmsLayer = null;
}
2
3
4
5
6
7
8
9
10
11
12
13
14
15
16
17
18
19
20
21
22
23
24
25
26
27
28
29
30
31
32
33
34
35
36
37
38
39
40
41
42
43
44
45
46
47
48
49
50
51
52
53
54
55
56
57
58
59
60
61
62
63
64
65
66
67
68
69
70
71
72
73
74
75
76
77
# Finally
Click https://vjmap.com/demo/#/demo/map/leaflet/01leafletraster (opens new window) to try the above features online
For Leaflet CAD loading development, see https://vjmap.com/demo/#/demo/map/leaflet/01leafletraster (opens new window)
For OpenLayers CAD loading development, see https://vjmap.com/demo/#/demo/map/openlayers/01olraster (opens new window)
For Maptalks CAD loading development, see https://vjmap.com/demo/#/demo/map/maptalks/01maptalksraster (opens new window)
For Vue3 Leaflet development, see https://github.com/vue-leaflet/vue-leaflet
For Vue2 Leaflet development, see https://github.com/vue-leaflet/Vue2Leaflet